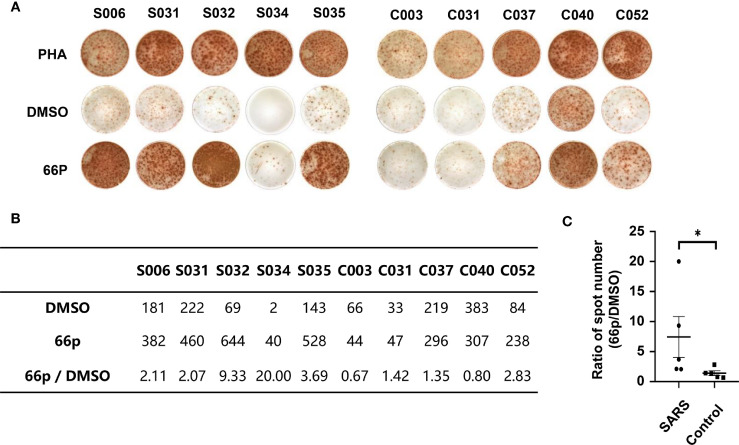
Figure 2.
T-cell immune response detected using the IFN-γ ELISPOT assay. (A) ELISPOT assay of PBMCs obtained from convalescent patients with SARS and control populations. PHA and DMSO were the positive and negative controls, respectively. (B) Table containing spot count from (A). (C) Graph depicting statistical analysis of (B); *P < 0.05.

