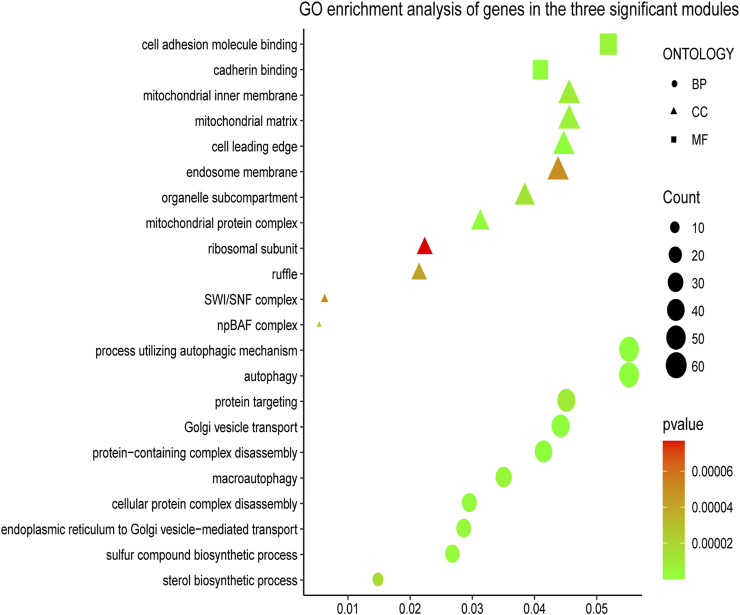
FIGURE 3.
Gene Ontology (GO) enrichment analyses of gene members in three chosen modules. The colored geometry represents GO term enrichment, dots represent biological process (BP), triangles represent molecular function (CC), rectangles represent cellular component (MF), red indicates low enrichment, and green indicates high enrichment. The sizes of the geometries represent the number of genes in each GO category.

