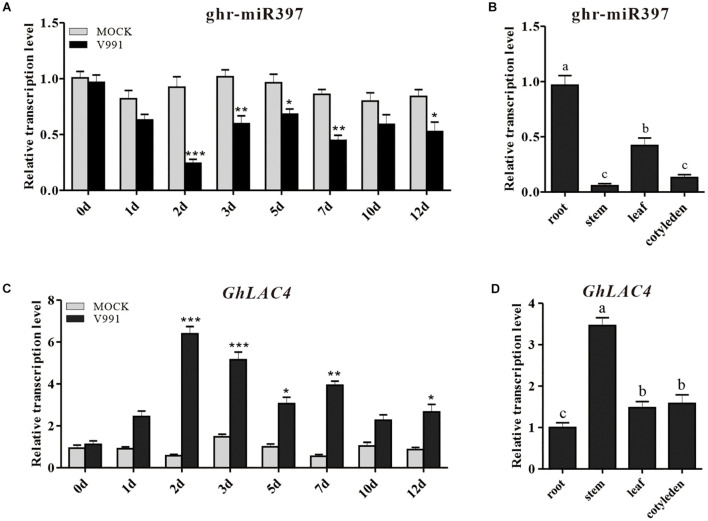
FIGURE 1.
Expression pattern analysis of ghr-miR397 and GhLAC4. (A) The ghr-miR397 accumulation under Verticillium dahliae infection and mock treatment. (B) The expression profile of ghr-miR397 in various cotton tissues. (C) Expression profile of GhLAC4 in the time course of cotton roots infected with V. dahliae. (D) Expression analysis of GhLAC4 in various cotton tissues. The abundance values of ghr-miR397 and GhLAC4 in cotton roots were arbitrarily assigned as ‘1.’ Mean with SD comes from triple repeats experiments. Significant differences in (A,C) were determined using Student’s t-test (*P < 0.05, **P < 0.01, ***P < 0.001). Different letters in (B,D) indicate significant differences (P < 0.05) based on Tukey’s HSD test.

