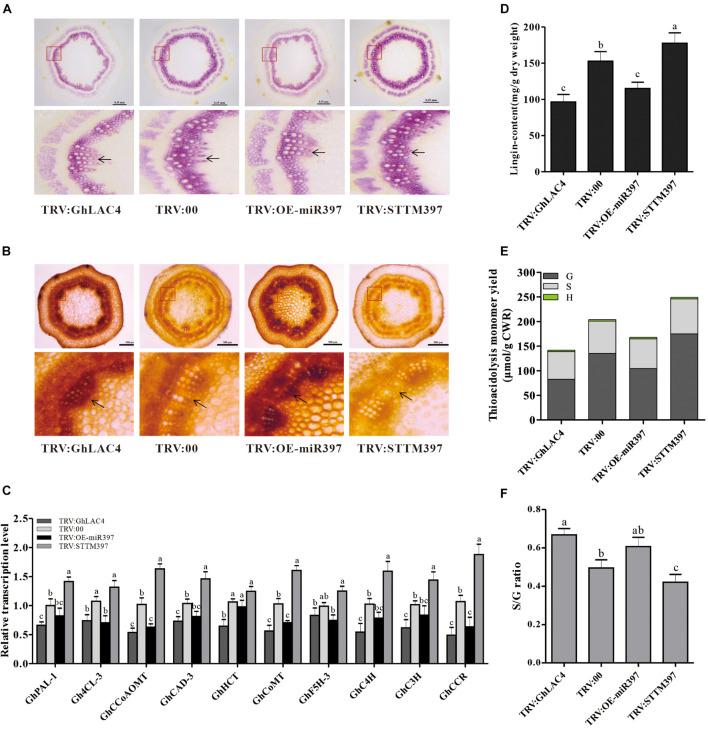
FIGURE 6.
Analysis of expression levels of lignin biosynthesis-related genes and lignin content and composition. (A,B) Stem cross slices stained with phloroglucinol-HCl (A) and Maüle staining method (B) in TRV:STTM397, TRV:OE-miR397, TRV:GhLAC4, and the control plants. The red boxes in up panels are enlarged as shown in down panels; the black arrow points to lignin fibres. Scale bars in (A) is 0.35 mm, (B) scale bars is 500 μm. (C) The relative expression levels of lignin biosynthesis-related genes in TRV:STTM397, TRV:OE-miR397, TRV:GhLAC4, and the control plants. (D) Analysis of Klason lignin content in TRV:STTM397, TRV:OE-miR397, TRV:GhLAC4, and the control plants. (E) Determination of the main H, G, and S thioacidolysis monomers released by the lignins of extract-free mature stems of laccase in TRV:STTM397, TRV:OE-miR397, TRV:GhLAC4, and the control plants. (F) S/G molar ratio in in TRV:STTM397, TRV:OE-miR397, TRV:GhLAC4, and the control plants. Mean with SD comes from triple repeats experiments. Different letters in (C,D,F) indicate significant difference (P < 0.05) based on Tukey’s HSD test.

