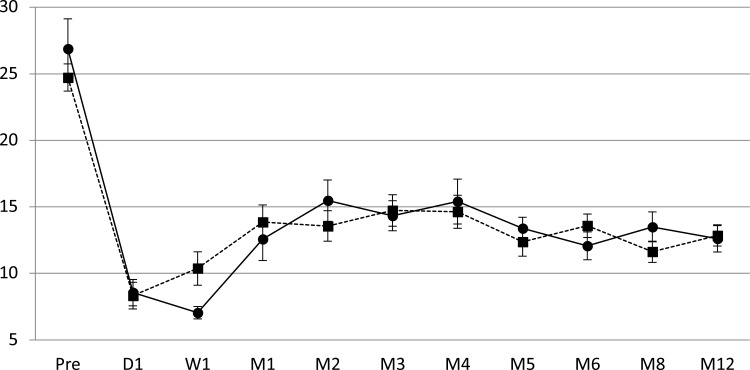
Figure 3.
Preoperative and postoperative mean IOP during follow-up period. We present mean IOP values in each study group. The bars represent the standard error at each follow-up visit. Vertical axis - Mean IOP in each group; horizontal axis - preoperative and postoperative visits; solid line - non-AMT group; dashed line - AMT group.

