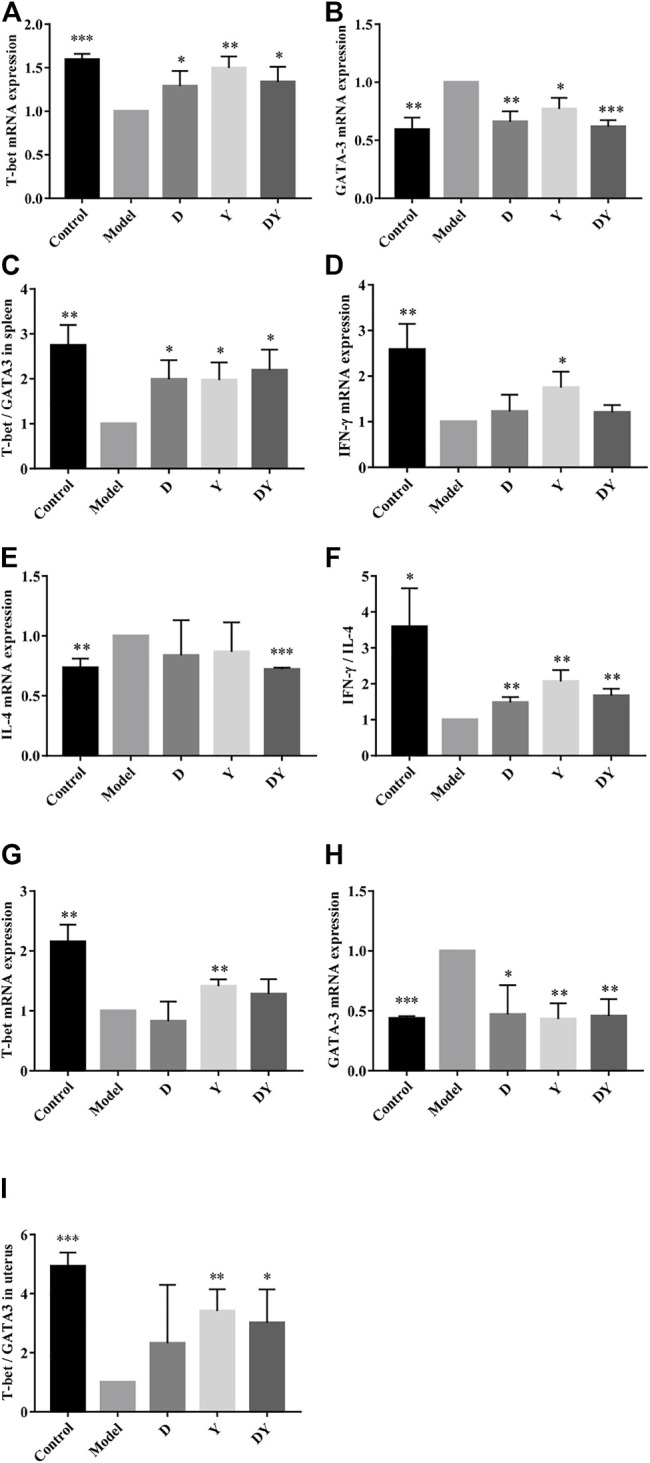
FIGURE 3.

Detection of T-bet and GATA-3 mRNA expression in spleen and uterus by RT-qPCR. The mRNA expression of T-bet (A) and GATA-3 (B) in spleen. Evaluation of T-bet/GATA-3 in the spleen (C). The mRNA expression of IFN-γ (D) and IL-4 (E) in spleen. Evaluation of IFN-γ/IL-4 in the spleen (F). The mRNA expression of T-bet (G) and GATA-3 (H) in uterus. Evaluation of T-bet/GATA-3 in the uterus (I). (***p < 0.001, **p < 0.01, and *p < 0.05, vs. Model group).
