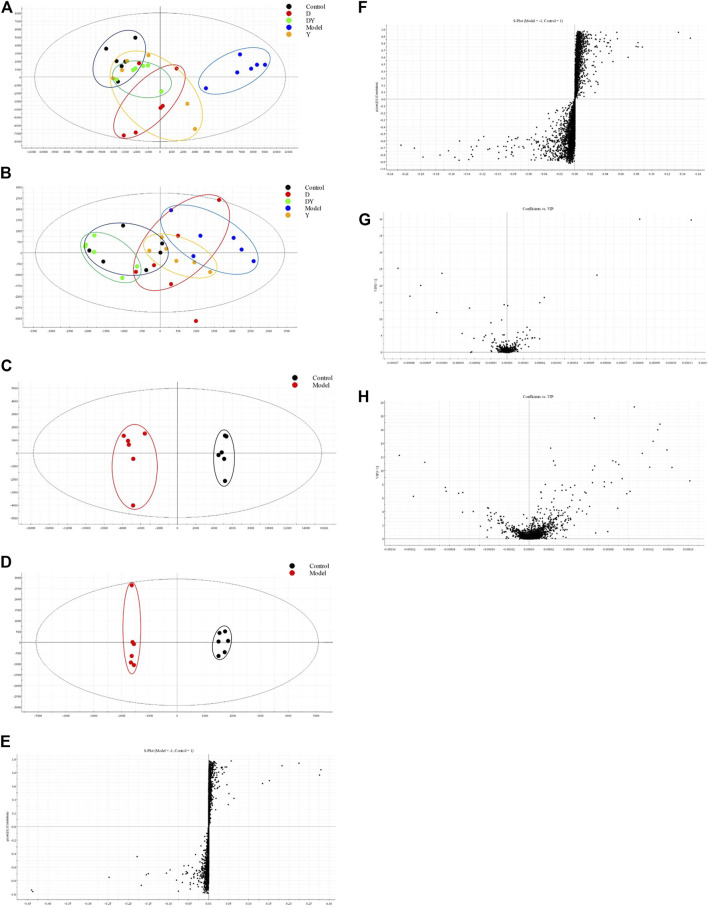
FIGURE 5.
PCA score plots of serum metabolic profile in positive (A) and negative (B) ESI modes. OPLS-DA score plots of serum metabolic profile in positive (C) and negative (D) ESI modes. S-plots of serum metabolic profile in positive (E) and negative (F) ESI modes. VIP-plots of serum metabolic profile in positive (G) and negative (H) ESI modes.

