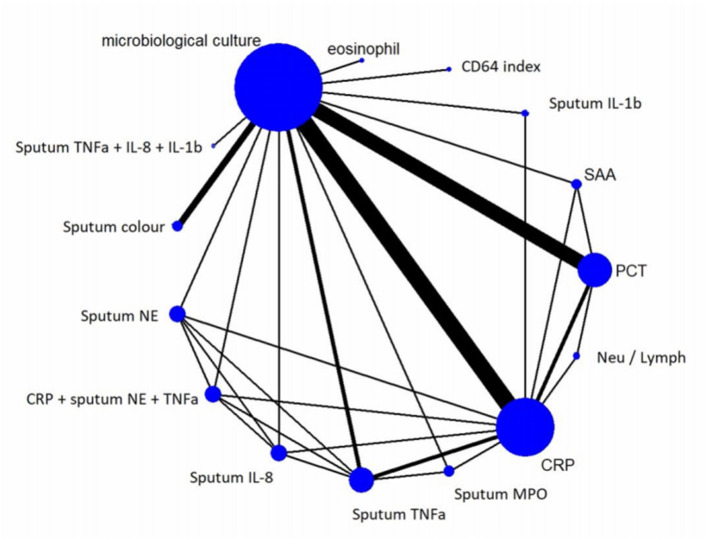
Figure 4.
Network Graph. The network graph enables visualization of the relations between examined index tests and the reference standard. The nodes represent the tests and the edges show the direct head-to head trials. The thickness of the edges is proportional to the number of direct head-to-head trials, and the size of the nodes is proportional to the sample sizes. CRP and PCT were the most commonly investigated biomarkers for predicting bacterial infection compared to microbiological culture in AECOPD. CRP, C-reactive protein; IL-1b, interleukin one beta; IL-8, interleukin eight; MPO, myeloperoxidase; NE, neutrophil elastase; N/L, neutrophil-lymphocyte ratio; PCT, procalcitonin; SAA, serum amyloid A; TNFa, tumor necrosis factor alfa.

