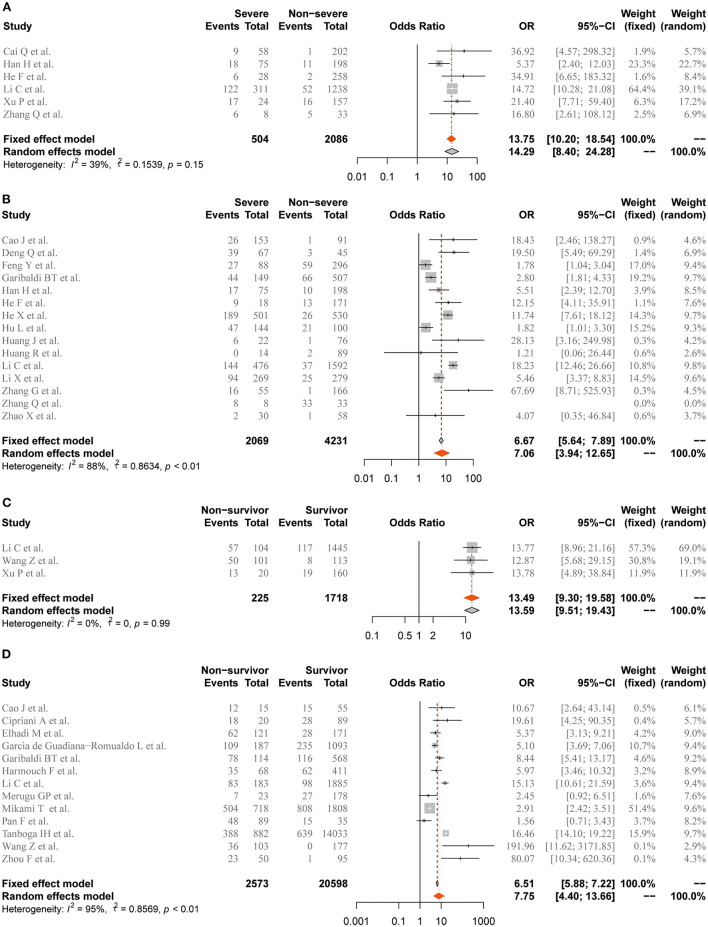
Figure 5.
Forest plot for the association of coronavirus disease 2019 (COVID-19)-related adverse outcomes with abnormal level of Mb or cTnI. (A) Severe illness and elevation of Mb. (B) Severe illness and elevation of cTnI. (C) In-hospital mortality and elevation of Mb. (D) In-hospital mortality and elevation of cTnI. Mb, myoglobin; cTnI, cardiac troponin I. Odds ratios (ORs) are presented with fixed-effects when I2 ≤50% and random-effects otherwise.

