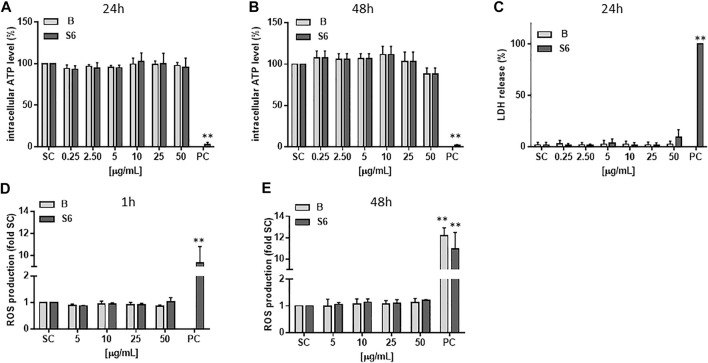
FIGURE 3.
Cytotoxicity and ROS production of Salix cortex extracts in differentiated HepaRG cells. ATP levels were analysed after (A) 24 h (B) 48 h of extract treatment. n = 3 (C) LDH cell release was measured after 24 h extract treatment. 0.2% Triton-X was used as positive control (PC). n = 4 (D, E) ROS production was measured by EPR spectroscopy after (D) 1 h or (E) 24 h of extract treatment. 200 μM menadione for 30 min. was used as positive control (PC). n = 3. The values are presented as means + SD. Ordinary one-way ANOVA was used for statistical analysis, followed by a Dunnett test versus solvent control (SC: 0.5% destilled water) group. **p < 0.01.

