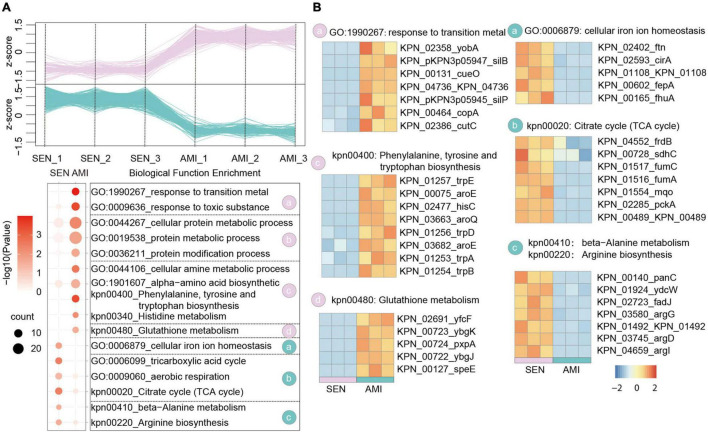
FIGURE 3.
Comparative Proteomics Analyses Revealed the metabolism alteration of AMI-resistant isolates comparing with SEN isolates. (A) Expression profiles (up) and representative function enrichment analysis (down) of differentially expressed genes between AMI-resistant isolates and SEN isolates. Each line represents one protein. Functional terms were labeled and color-coded with p-value (Fisher’s exact test) according to the legend. (B) Expression patterns of proteins participating in the indicated cellular functions/pathways across AMI-resistant or SEN isolates. Values for each protein in all groups are color-coded based on the z-scored protein abundance per cell.

