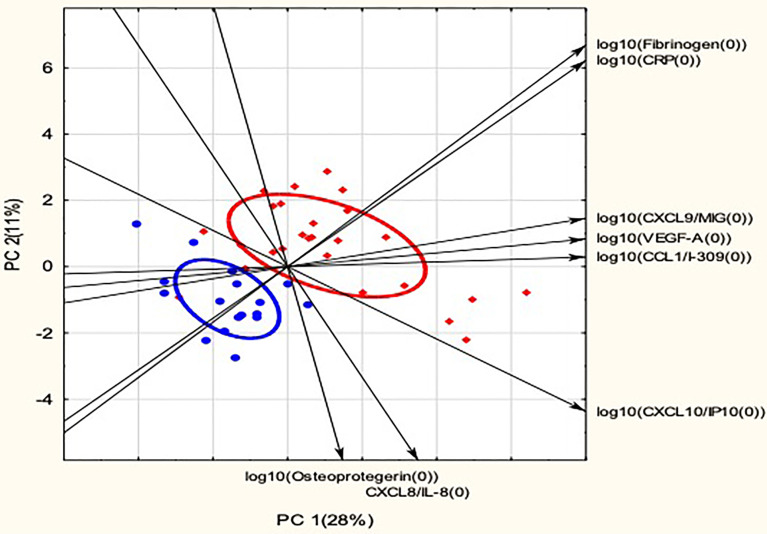
Figure 3.
Principal Component Analysis of biomarker distributions in spinal TB and mechanical back pain. Red diamonds indicate scores for spinal TB and blue dots indicate scores for mechanical back pain. Ellipses indicate 50% confidence ellipses for spinal TB and mechanical back pain, respectively. Arrows indicate the direction of increasing biomarker levels. Only biomarkers with R2 > 0.40 for principal components 1 and 2 are shown. PC, Principal Component with the percentage of variation explained by the principal component shown in brackets.

