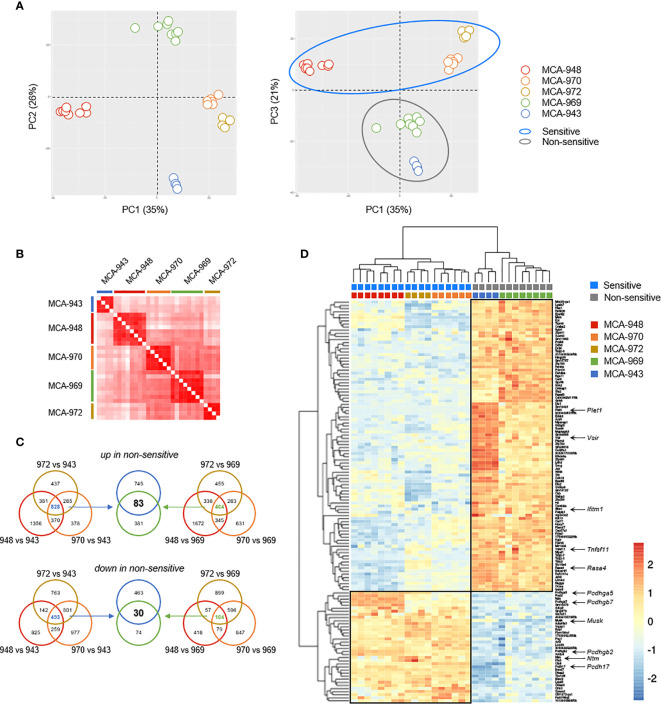
Figure 6.
Tumor cell analysis by RNAseq. (A) Principal component analysis (PCA) of 30 tumors originating from 5 parental MCA-induced primary tumor cells subjected to RNAseq. (B) Correlation matrix of overall transcriptomic profiles. (C, D) Analysis of differentially expressed genes. Venn diagram (C) illustrating the strategy used to extract the common transcriptomic signatures (D) of sensitive and non-sensitive MCA-induced primary tumor cell lines.

