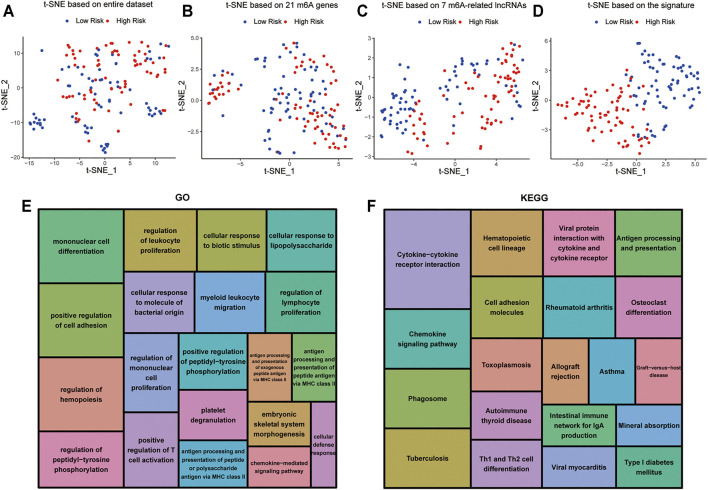
FIGURE 8.
Cellular biological effects related to the signature (A) Based on whole gene expression profiles. (B) Based on 21 m6A genes. (C) Based on 7 m6A-related lncRNAs. (D) Based on the signature. (E) GO function annotation showed the top 20 enriched biological processes. (F) KEGG pathway analysis showed the top 20 enriched pathways.

