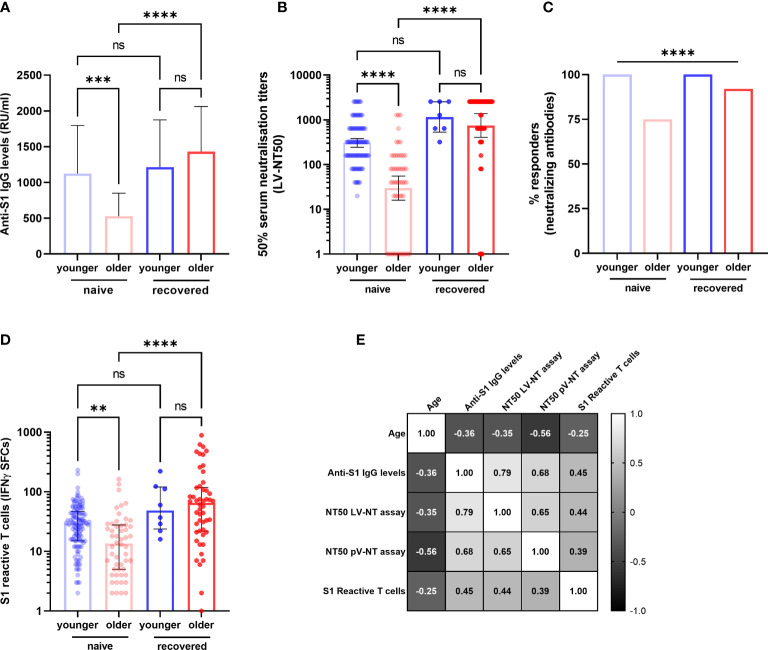
Figure 3.
Specific antibody and T-cell responses in older and in young adults 3 months after the first injection of BNT162b2. (A) Antibody responses assessed by ELISA (anti-S1 IgG) (COVID-19-naive younger n = 121, COVID-19-naive older n = 54, COVID-19-recovered young n = 8, COVID-19-recovered older n = 47; median [interquartile range (IQR)] are shown). (B) Serum neutralization assay against live virus (COVID-19-naive young adults n = 101, COVID-19-naive older n = 52, COVID-19-recovered young n = 7, COVID-19-recovered older n = 51; geometric median and 95% confidence interval are shown). (C) Participants with detectable neutralizing antibodies according to live virus-neutralizing assay (titer ≥1:20). (D) Number of S1 peptide pool reactive T cells (ELISpot) (COVID-19-naive young adults n = 121, COVID-19-naive older n = 52, COVID-19-recovered young n = 8, COVID-19-recovered older n = 50; median [interquartile range (IQR)] are shown). (E) Correlations between age and main immune parameters of the postvaccinal response at 3 months in COVID-19-naive older and COVID-19-naive young adults. Values are Spearman’s rank correlation (r) coefficients. The number of pairs that were analyzed, p-values and 95% confidence intervals of significant correlations are detailed in Table 2 . ** p-values <0.01; *** p-values < 0.001; **** p-values < 0.0001; ns, not significant. IFNγ SFCs, interferon gamma spot-forming cells; LV-NT50, 50% serum neutralization titer in live virus neutralization assay; pV-NT50, 50% serum neutralization titer in pseudovirus neutralization assay.

