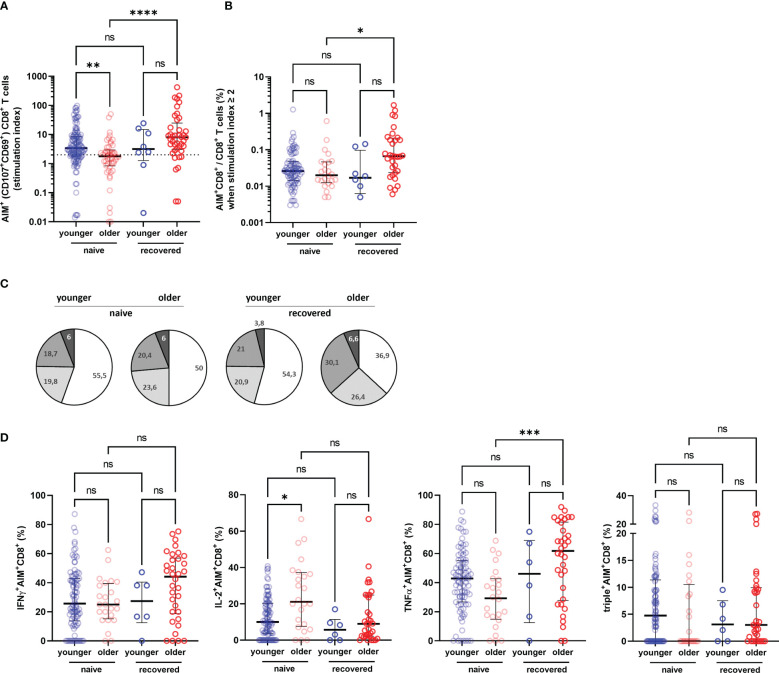
Figure 6.
Specific CD8+ T-cell response in older and in young adults 3 months after the first injection of BNT162b2. (A) Specific CD8+ T cells according to activation-induced markers (AIM), reported with their stimulation index. (B) Percentage of AIM+CD8+ T cells among total CD8+ T cells in responders, i.e., participants with a stimulation index ≥2. (C) Pie charts representing the relative proportions of AIM+CD8+ T cells producing none (white), one (light grey), two (medium grey), or three cytokines (dark grey) out of INFγ, IL-2, and TNFα according to participant group and past history of COVID-19 (naive and recovered). (D) Proportion of AIM+CD4+ cells producing IFNγ, IL-2, TNFα, and proportion of IFNγ+IL-2+TNFα+ (triple+) CD4+ T cells according to participant group and past history of COVID-19 (naive and recovered). (COVID-19-naive young adults n = 113, COVID-19-naive older n = 48, COVID-19-recovered young n = 8, COVID-19-recovered older n = 41; median [interquartile range (IQR)] are shown). * p-values < 0.05; ** p-values < 0.01; *** p-values < 0.001; **** p-values < 0.0001; ns, not significant. AIM+, cell-expressing activation-induced markers.

