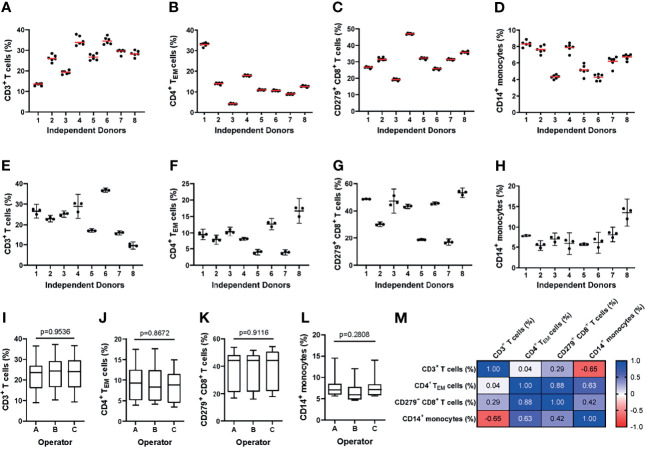
Figure 3.
Evaluating the intra- and inter-assay precision of the MoT test. (A–D) For evaluation of intra-assay precision, 6 replicates from fresh whole blood EDTA samples from n = 8 healthy donors were stained using the MoT test. (E–I) For evaluation of inter-assay precision, fresh whole EDTA blood from n = 8 healthy donors was stained in parallel by three different operators. Frequencies of CD3+ T cells (A, E), CD4+ TEM cells (B, F), CD279+ CD8+ T cells (C, G) and CD14+ monocytes (D, H) were determined (A–D: replicates are represented by dots, mean is displayed as red line; (E–H): operator-dependent results are displayed as scatter dot plot with line at mean and 95% CI). (I–L) Reporter frequencies of inter-assay precision analyses (K.W. test). (M) Correlations (Pearson r) between reporters measured by the MoT test.

