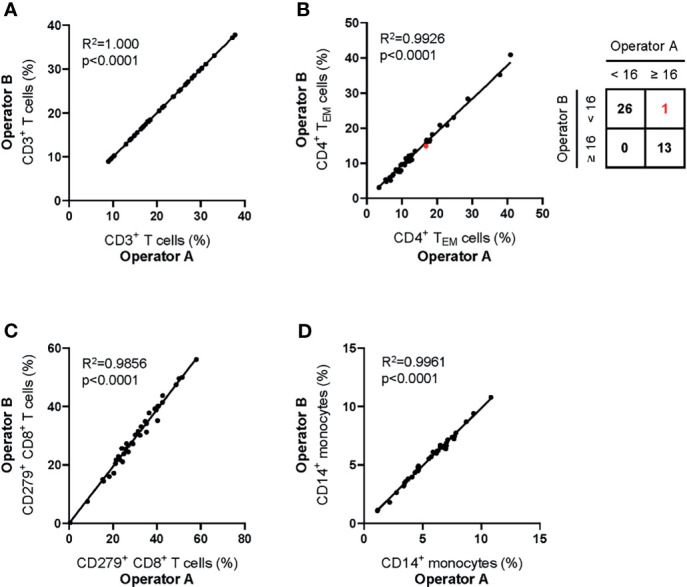
Figure 4.

Inter-operator analytical precision of the MoT test. Fresh whole blood EDTA samples from n = 20 healthy donors and n=20 melanoma patients (stage II: n = 7; stage III: n = 3; stage IV: n = 10) were processed using the MoT test. Flow cytometry data were analyzed by two experienced operators according to the gating strategy shown in Figure 2 . Frequencies of CD3+ T cells (A), CD4+ TEM cells (B), CD279+ CD8+ T cells (C) and CD14+ monocytes (D) were determined. One sample of borderline CD4+ TEM cell frequency was differently classified by the two operators (marked in red; inter-operator concordance of 98%).
