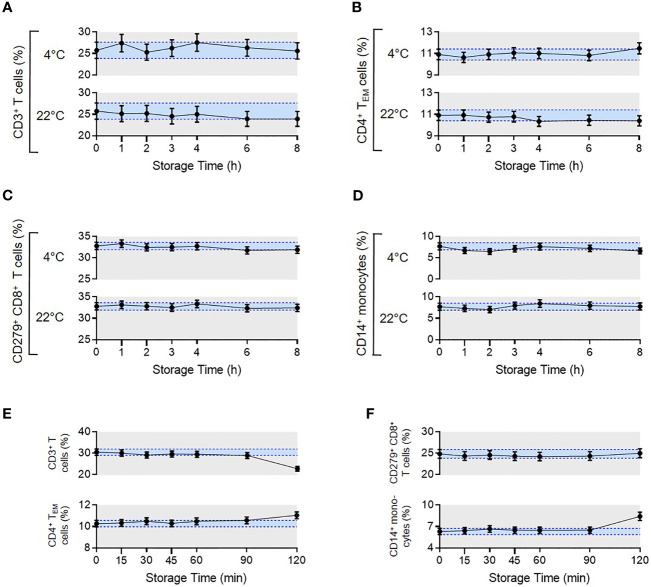
Figure 5.
Pre- and post-analytical stability of the MoT test. To evaluate pre-analytical stability, whole blood EDTA samples from n = 4 healthy donors were either stored at 4°C in the dark in the fridge or light exposed at room temperature. Processing the samples started either directly after blood draw (0 h) or delayed in time (1-8 h). Acquired flow cytometry data were analyzed and frequencies of CD3+ T cells (A), CD4+ TEM cells (B), CD279+ CD8+ T cells (C) and CD14+ monocytes (D) were determined. Mean CVs of intra-assay precision were used for calculation of SDs. Results are displayed as mean with 95% CI. For the analysis of post-analytical stability, acquisition of fully processed blood samples from healthy donors (n = 3 for CD279+ CD8+ T cells, n = 6 for all other reporters) started either immediately after staining or delayed in time (15-120 min). (E, F) Frequencies of CD3+ T cells, CD4+ TEM cells, CD279+ CD8+ T cells and CD14+ monocytes were determined. Mean CVs of intra-assay precision were used for calculation of SDs. Results are displayed as mean with 95% CI.

