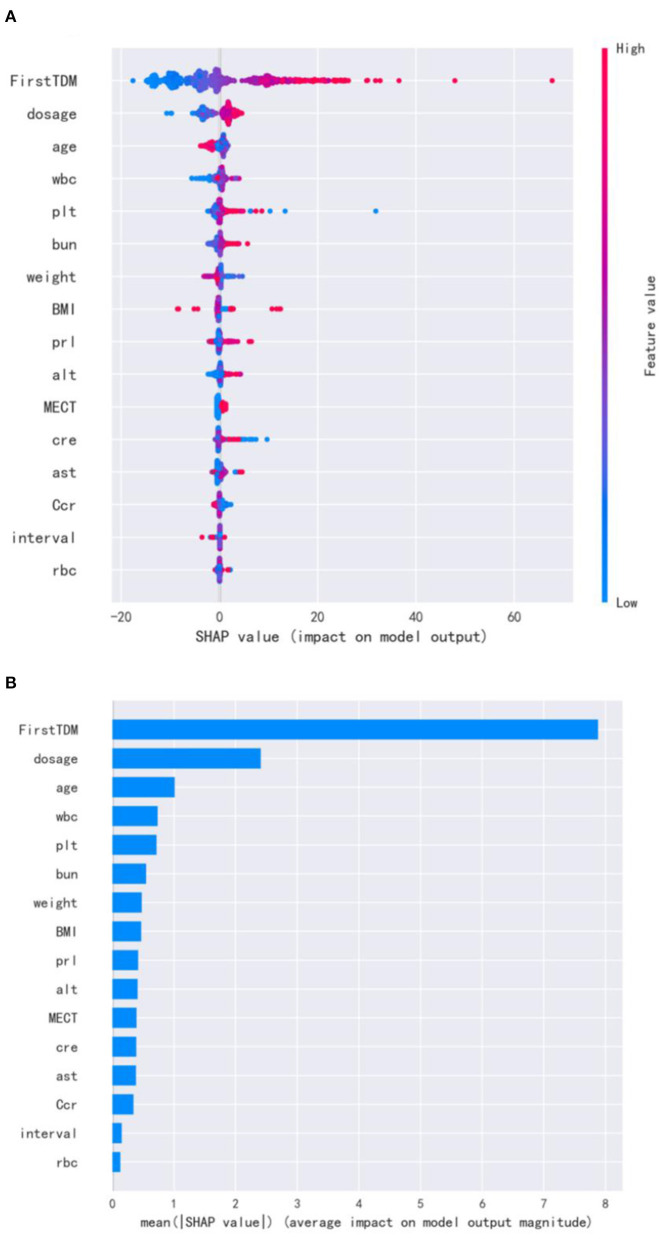
Figure 2.
SHAP for important variables affecting the next risperidone TDM. (A) visualization of the variable impacts. The dot color is redder when the feature value gets higher and bluer when the feature value gets lower. When the SHAP value gets higher, the impact of the variable on model output is larger. (B) Ranking of the mean absolute SHAP values. The larger mean absolute SHAP value indicates the stronger correlation.

