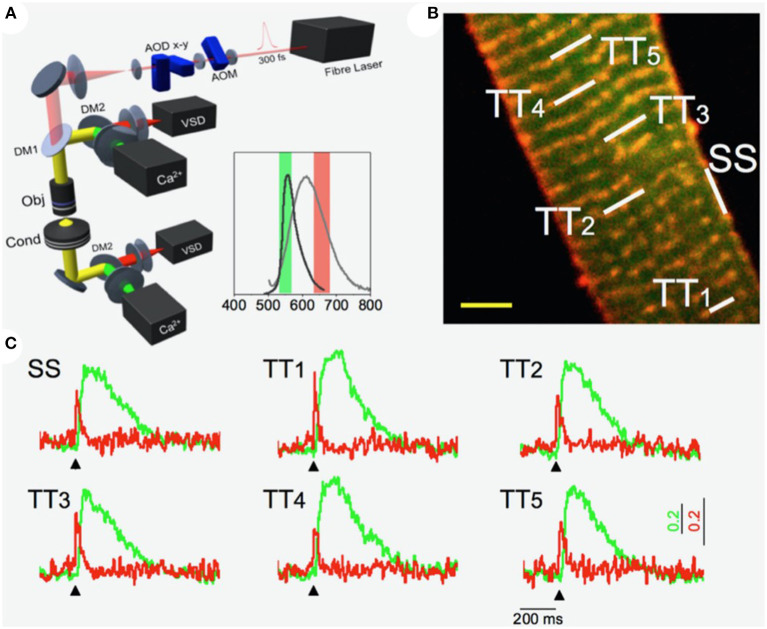
Figure 1.
Multi-site voltage and Ca2+ recording. (A) Scheme of the Random Access Multi-Photon (RAMP) microscope based on two orthogonally-mounted acousto-optical deflectors (AODs -x and -y) for laser scanning. Inset shows the emission spectra of the Ca2+ indicator (in dark gray) and voltage sensitive dye (in light gray) together with their fluorescence filter acquisition band. (B) Image of a stained rat ventricular cardiac cell: di-4-ANE(F)PPTEA in red and GFP-certified Fluoforte in green. Scale bar: 5 μm (C) Real time fluorescence traces collected from the scanned sites indicated in white in (B): surface sarcolemma (SS) and five T-tubules (TTi). Membrane voltage is shown in red and Ca2+ in green. Reproduced and modified from Crocini et al. (2014).

