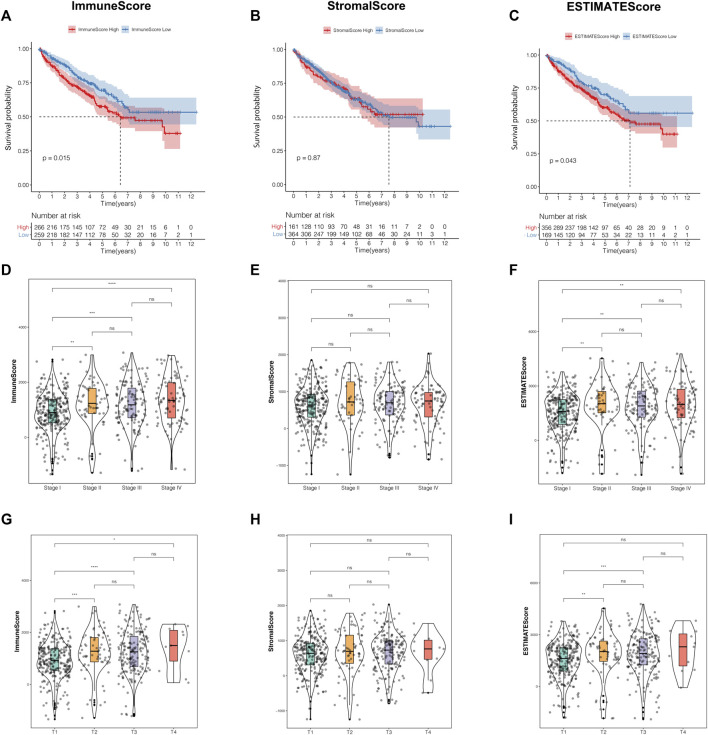
FIGURE 1.
The TME characteristics were correlated with clinical features in ccRCC patients. (A–C) The Kaplan–Meier analysis was generated to display the survival significances of different groups stratified by the median value of the immune score (A), stromal score (B), and estimate score (C). (D–F) Distribution of the immune score (D), stromal score (E), and estimate score (F) in the different stages. (G–I) Distribution of the immune score (G), stromal score (H), estimate score (I) in the different T classifications. TME, tumor microenvironment; ccRCC, clear cell renal cell carcinoma.

