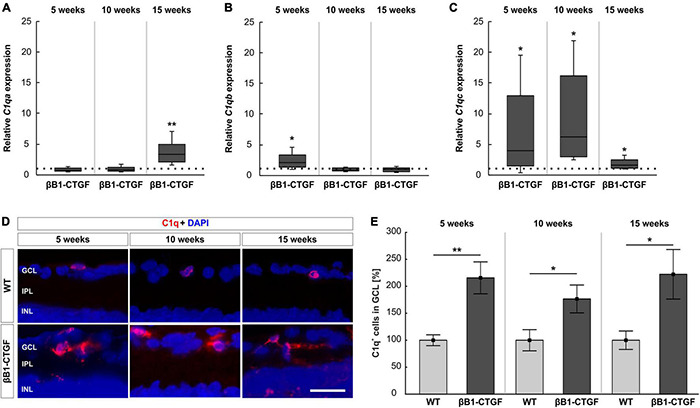
FIGURE 4.

C1q upregulation in transgenic animals. (A) RT-qPCR analyses revealed no alterations in C1qa mRNA levels in βB1-CTGF mice at 5 and 10 weeks. At 15 weeks, a significant upregulation of C1qa mRNA levels was seen (p = 0.005). (B) At 5 weeks, C1qb mRNA levels were significantly upregulated (p = 0.04), while no changes were noted at 10 and 15 weeks. (C) The mRNA levels of C1qc were significantly upregulated in transgenic mice at 5 (p = 0.04), 10 (p = 0.01), and 15 weeks of age (p = 0.03). (D) Retinal cross-sections were labeled with an antibody against C1q (red), while DAPI counterstained cell nuclei (blue) in 5-, 10-, and 15-week-old mice. (E) The number of C1q+ cells in the ganglion cell layer was significantly higher in βB1-CTGF and WT animals at 5 (p = 0.003), 10 (p = 0.04), and 15 weeks (p = 0.03). Values for RT-qPCR are median ± quartile ± minimum/maximum (n = 5–7/group). The dotted line in panels (A–C) represents the relative expression of the WT group. Values for immunohistology are mean ± SEM (n = 7–9/group). GCL, ganglion cell layer; IPL, inner plexiform layer; INL, inner nuclear layer. Scale bar: 20 μm. *p < 0.05, **p < 0.01.
