Abstract
Purpose
To investigate if a deep learning convolutional neural network (CNN) could enable low-dose fluorine 18 (18F) fluorodeoxyglucose (FDG) PET/MRI for correct treatment response assessment of children and young adults with lymphoma.
Materials and Methods
In this secondary analysis of prospectively collected data (ClinicalTrials.gov identifier: NCT01542879), 20 patients with lymphoma (mean age, 16.4 years ± 6.4 [standard deviation]) underwent 18F-FDG PET/MRI between July 2015 and August 2019 at baseline and after induction chemotherapy. Full-dose 18F-FDG PET data (3 MBq/kg) were simulated to lower 18F-FDG doses based on the percentage of coincidence events (representing simulated 75%, 50%, 25%, 12.5%, and 6.25% 18F-FDG dose [hereafter referred to as 75%Sim, 50%Sim, 25%Sim, 12.5%Sim, and 6.25%Sim, respectively]). A U.S. Food and Drug Administration–approved CNN was used to augment input simulated low-dose scans to full-dose scans. For each follow-up scan after induction chemotherapy, the standardized uptake value (SUV) response score was calculated as the maximum SUV (SUVmax) of the tumor normalized to the mean liver SUV; tumor response was classified as adequate or inadequate. Sensitivity and specificity in the detection of correct response status were computed using full-dose PET as the reference standard.
Results
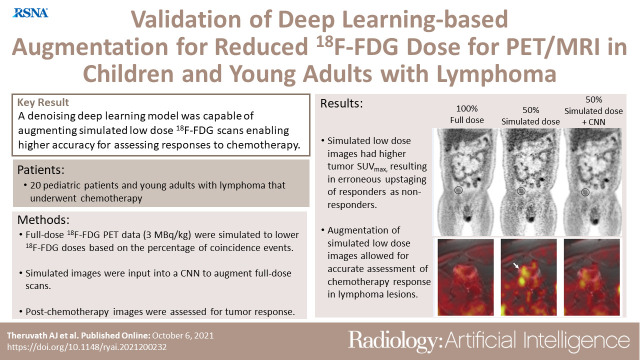
With decreasing simulated radiotracer doses, tumor SUVmax increased. A dose below 75%Sim of the full dose led to erroneous upstaging of adequate responders to inadequate responders (43% [six of 14 patients] for 75%Sim; 93% [13 of 14 patients] for 50%Sim; and 100% [14 of 14 patients] below 50%Sim; P < .05 for all). CNN-enhanced low-dose PET/MRI scans at 75%Sim and 50%Sim enabled correct response assessments for all patients. Use of the CNN augmentation for assessing adequate and inadequate responses resulted in identical sensitivities (100%) and specificities (100%) between the assessment of 100% full-dose PET, augmented 75%Sim, and augmented 50%Sim images.
Conclusion
CNN enhancement of PET/MRI scans may enable 50% 18F-FDG dose reduction with correct treatment response assessment of children and young adults with lymphoma.
Keywords: Pediatrics, PET/MRI, Computer Applications Detection/Diagnosis, Lymphoma, Tumor Response, Whole-Body Imaging, Technology Assessment
Clinical trial registration no: NCT01542879
Supplemental material is available for this article.
© RSNA, 2021
Keywords: Pediatrics, PET/MRI, Computer Applications Detection/Diagnosis, Lymphoma, Tumor Response, Whole-Body Imaging, Technology Assessment
Summary
Deep learning may enable a reduction in dose of fluorine 18 fluorodeoxyglucose in integrated PET/MRI scans of children and young adults with lymphoma for treatment response assessment without compromising diagnostic sensitivity and specificity.
Key Points
■ A simulated fluorine 18 (18F) fluorodeoxyglucose (FDG) radiotracer dose reduction below 75% at PET/MRI resulted in incorrect treatment response assessment of children and young adults with lymphoma.
■ Deep learning–enhanced simulated low-dose PET/MRI scans enable dose reductions of 18F-FDG of up to 50% without changing response assessment.
Introduction
Therapy response of lymphomas is typically monitored with PET/CT after intravenous injection of fluorine 18 (18F) fluorodeoxyglucose (FDG) (1). However, the ionizing radiation exposure associated with multiple CT scans is of concern for pediatric patients at increased risk of developing secondary cancers (2–6). To address this problem, integrated 18F-FDG PET/MRI technologies have been developed that substitute MRI for CT (7,8), thereby reducing the radiation exposure of the patient by 70%–80% (7,9).
Radiation exposure to the patient can be also reduced by reducing the 18F-FDG radiotracer dose. This approach would benefit both 18F-FDG PET/MRI and 18F-FDG PET/CT staging procedures. However, several investigators have reported that reduced 18F-FDG radiotracer doses lead to an apparent increase in the maximum standardized uptake value (SUVmax) of the tumor tissue (10–13). As the radiotracer dose decreases, true coincidence events decrease and random events (noise) increase, which leads to an increasing difference between tumor SUVmax and mean standardized uptake value (SUVmean) of liver and mediastinal blood pool as internal reference tissues (14,15). Although this is a minor problem for staging highly metabolically active tumors at baseline, the increased noise on follow-up scans can result in upstaging of tumors with low metabolic activity. With superimposed noise, tumors with relatively low metabolic activity can appear of equal or even higher PET signal compared with internal reference tissues, which in turn affects the Deauville score for therapy response assessment and decisions concerning patient care (16–18). The Deauville score is a five-point scale, recommended by the Lugano classification system for response assessment of Hodgkin and non-Hodgkin lymphoma, that relates the PET signal of target lesions to reference regions of normal mediastinum and liver and permits a threshold for adequate or inadequate response (19,20).
To address this problem, we used a deep learning (DL) convolutional neural network (CNN) to enhance simulated low-dose 18F-FDG PET scans from children and young adults with lymphoma such that the relationship between tumor and reference tissues would be consistent with that of 100% dose scans. To our knowledge, the application of DL CNN in dose reduction of 18F-FDG PET scans in pediatric lymphoma has not previously been investigated, nor has the effect of CNN on tumor therapy response assessments on 18F-FDG PET scans been considered. Previous studies on dose reduction have focused on studies at baseline, when tumors typically demonstrate strong radiotracer uptake compared with healthy reference tissues (10,11,21). It is more challenging to resolve variable changes in tumor radiotracer uptake compared with reference tissues after chemotherapy when tumors have low 18F-FDG metabolism. Taking these important variables into account, the goal of our study was to investigate if a CNN enables low-dose 18F-FDG PET for correct treatment response assessment of patients with lymphoma.
Materials and Methods
Patient Sample
This Health Insurance Portability and Accountability Act–compliant clinical study was approved by our institutional review board and performed as a secondary analysis of prospectively acquired data (ClinicalTrials.gov identifier: NCT01542879). Written informed consent was obtained from all adult patients and all parents of pediatric patients. In addition, pediatric patients were asked to give their assent to participate in the study. We enrolled 20 children and young adults with lymphoma between July 2015 and August 2019. Inclusion criteria comprised the following: (a) age younger than 30 years, (b) histologically proven lymphoma, (c) PET/MRI at baseline and after induction chemotherapy, and (d) completed first-line chemotherapy. Exclusion criteria were (a) MRI-incompatible metal implants, (b) claustrophobia, and (c) pregnancy.
Image Acquisition
All patients underwent whole-body integrated 18F-FDG PET/MRI at baseline and after induction chemotherapy with a 3-T Signa PET/MRI scanner (software version MP26, GE Healthcare) using a 32-channel torso phased-array coil and an eight-channel, receive-only head coil. Before undergoing the scanning, patients were asked to fast for at least 4 hours and demonstrate a blood glucose level below 140 mg/dL. 18F-FDG was administered intravenously approximately 60 minutes (mean ± standard deviation, 56 minutes ± 3; range, 51–62 minutes) before scanning at a dose of 3 MBq per kilogram of body weight. The imaging protocol consisted of an axial Dixon sequence for PET attenuation correction and axial breath-hold gradient-echo fat-saturated T1-weighted sequence. Details of the pulse sequence parameters are included in Table E1 (supplement). PET data were acquired simultaneously with MRI scans, using a 25-cm transaxial field of view and 3-minute 30-second acquisitions per PET bed. The PET data were reconstructed using scanner-specific algorithms (three-dimensional ordered subsets expectation maximization: 28 subsets, two iterations, with time-of-flight and point spread function information), accounting for attenuation from coils and patient cradle.
Radiotracer input data were used to generate 18F-FDG PET images. Full-dose (3 MBq/kg) PET data were acquired in list mode, which helps detect coincidence events across the entire duration of the PET bed time (3 minutes 30 seconds). Low-dose PET images were retrospectively simulated by unlisting the PET list-mode data and reconstructing them based on the percentage of coincidence events (22). The list-mode PET input data collected over a time period of the first block of 3 minutes 30 seconds, 2 minutes 38 seconds, 1 minute 45 seconds, 53 seconds, 26 seconds, and 13 seconds were used to simulate 100%, 75%, 50%, 25%, 12.5%, and 6.25% 18F-FDG dose levels (hereafter referred to as 75%Sim, 50%Sim, 25%Sim, 12.5%Sim, and 6.25%Sim, respectively).
A commercially available U.S. Food and Drug Administration–approved software (SubtlePET, version 1.3, Subtle Medical) was used to enhance the image quality of the synthesized low-dose PET images. This software, which uses a 2.5D encoder-decoder U-Net CNN to perform PET denoising (23), was trained on pairs of low- and high-count PET studies obtained from whole-body PET/MRI and PET/CT acquisitions from multiple different vendors and institutions from pediatric and adult populations. This DL CNN had been previously validated for augmentation of brain scans in adult patients (24,25) and was cross-trained for augmentation of whole-body scans.
The PET/MRI scans included in this study were not included in the training of this algorithm, making it a true external test set. The inputs to this CNN were only the low-dose images, and the outputs were the DL-enhanced images, which had improved signal-to-noise ratios compared with the low-dose images.
Image Analysis
At baseline, two experienced radiologists (H.E.D.L. and A.J.T., with >20 years and 6 years of experience, respectively) identified up to six measurable target lesions per patient in consensus according to the Lugano classification (20). In patients with multiple lesions, the hottest and typically largest lesions were selected. The radiologists were blinded to tumor histopathologic characteristics, clinical data, and treatment outcomes. Based on the identified target lesions, two radiologists (F.S. and A.J.T., each with 6 years of experience) measured SUVmax and standardized uptake value (SUV) standard deviation (in grams per milliliter) of all target lesions and SUVmean and SUV standard deviation (in grams per milliliter) of liver and mediastinal blood pool on baseline and follow-up scans by placing a three-dimensional volume of interest over tumor lesions, mediastinal blood pool, and right liver lobe. This was performed in random order for all patients for each simulated dose group on conventional and DL-augmented PET images using MIM version 6.5 (MIM Software). SUV values were calculated based on patient body weight by using the following equation: SUV = tissue tracer activity (in millicuries per milliliter)/[injected dose (in millicuries)/patient body weight (in grams)].
On follow-up scans, each patient was classified as an adequate or inadequate responder, using the SUVmean of the liver as an internal reference tissue (19). According to the Deauville score, a target lesion demonstrates inadequate response if the most intense tumor 18F-FDG signal is moderately or markedly higher than that of the liver (score 4 and 5) and a target lesion demonstrates adequate response if the most intense tumor 18F-FDG signal is lower than that of the liver and/or mediastinum (score 1–3) (19).
Statistical Analysis
SUVmax of target tumors and SUVmean of the liver on baseline scans were compared using a mixed random effects model in which the label of the lesion (liver and targeted lesions) was the fixed effect and the patients and readers were the random effect. For the follow-up PET scans, the SUVmax of the target tumor was normalized to the SUVmean of the liver in each patient; this is termed the SUV response score.
Patients were considered adequate responders (negative for disease) if all hypermetabolic lesions detected at baseline had SUV response scores less than 1 on follow-up scans, whereas inadequate response (positive for disease) was considered if at least one of the target lesions on follow-up scans or a newly detected lesion on follow-up scans had a SUV response score of more than 1. Because two readers agreed 100% on patient responder status for all study patients under similar imaging conditions, we report the results for only one reader without reference to readers. Change of response status above and below 75%Sim dose groups was analyzed using the Fisher exact test. The full-dose image SUV response scores were used as a standard of reference for all statistical analyses. Concordances were evaluated for each reader using the exact McNemar test and summarized as Cohen κ statistics with exact 95% CIs (26).
Pairwise differences in SUV response scores for matched target lesions between the full dose and simulated low dose with and without DL enhancement were estimated using a generalized estimating equation approach that calculated within-patient mean differences of target lesions first for both readers and then averaged within-patient mean difference across all patients. For each comparison of simulated lower-dose images with or without DL enhancement versus the full-dose images, we randomly permuted dose labels for each study patient to generate 200 000 samples under the null hypothesis of no difference between two imaging conditions. A two-sided P value was then derived as the proportion of samples that had absolute generalized estimating equation mean difference above the observed generalized estimating equation mean value. A modified Lin concordance correlation coefficient (ρ value) was used to measure the agreement between the SUV response scores of all target lesions between the full-dose images and the simulated low-dose PET images and was calculated for each reader using the following equation (27), where the μx and σx are the mean and standard deviation of the SUV response scores from the full dose, μy and σy are the mean and standard deviation of the SUV response from the simulated low dose, and ρ is the correlation coefficient between the SUV response scores from the full dose and the simulated low dose:
 |
Here, the covariance ρσxσy and total variance were calculated first for individual patients and then averaged across patients to obtain population level of covariance as the numerator and population total variance as the denominator.
The sensitivity and specificity of the simulated low-dose PET images with and without DL enhancement to ascertain response status were computed with their corresponding exact 95% CIs using the R software package binom (version 1.2.5033; The R Project for Statistical Computing). All quantitative analyses were calculated by our statistician (Y.L., with >20 years of experience) based on the assessments of the readers, who were blinded to clinical outcomes. All quantitative analyses were performed using Python (version 3.6.7, Python Software Foundation) using the NumPy (version 1.16) and SciPy (version 1.3) libraries for statistical analysis and the matplotlib (version 3.1) and seaborn (version 0.8.1) libraries for visualization. as well as GraphPad Prism (version 6.0, GraphPad Software) and RStudio (version 1.2.5033). P < .05 was indicative of a statistically significant difference.
Results
Patient Demographics
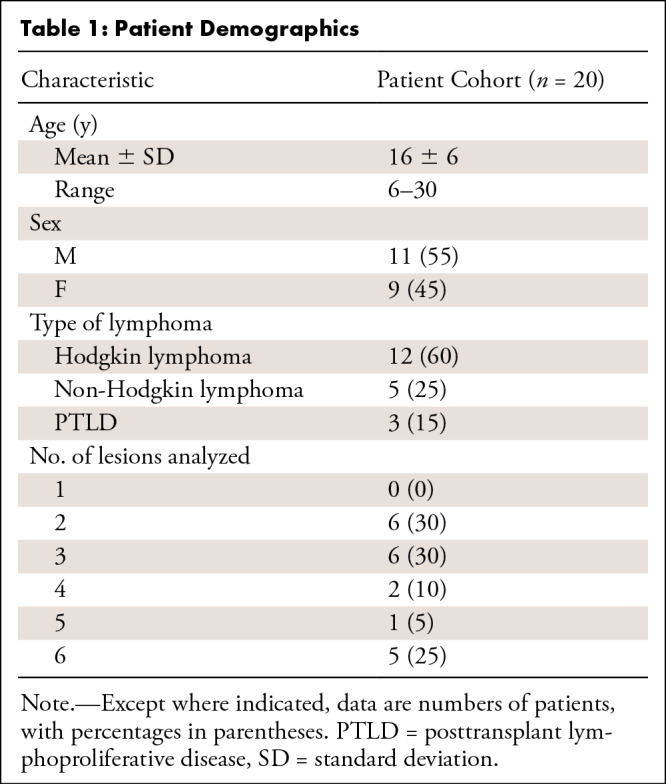
The flowchart of our study cohort is shown in Figure E1 (supplement). Twenty-seven patients who met the inclusion criteria were invited to participate in our study. Seven patients were excluded after baseline 18F-FDG PET/MRI because follow-up scanning was performed with 18F-FDG PET/CT, leaving 20 patients for the final analysis. Patient demographics are summarized in Table 1. We enrolled a total of 11 male and nine female patients (mean age, 16 years ± 6; range, 6–30 years) with Hodgkin lymphoma (60% [12 of 20 patients]), non-Hodgkin lymphoma (25% [five of 20 patients]), or posttransplant lymphoproliferative disorder (15% [three of 20 patients]).
Table 1:
Patient Demographics
Simulation of Reduced Radiotracer Doses Impaired Tumor SUV Measurements on PET/MRI Scans
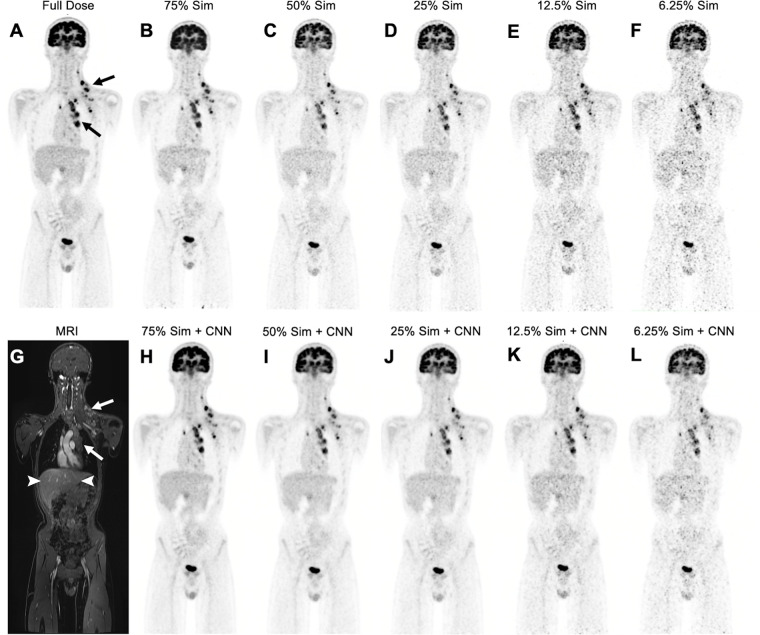
At baseline, all evaluated target tumors (n = 73) in the 20 patients demonstrated higher metabolic activity (mean SUVmax, 13.5 ± 7.9) on 100% dose PET scans compared with the liver as an internal reference standard (SUVmean, 1.6 ± 0.4; P < .001). As the simulated radiotracer dose was reduced, images exhibited higher image noise and lower contrast between the tumor and liver (Fig 1).
Figure 1:
Low-dose and deep learning–enhanced PET images in a 14-year-old boy with Hodgkin lymphoma. (A) Full-dose fluorine 18 (18F) fluorodeoxyglucose (FDG) PET image (3 MBq/kg) shows hypermetabolic mediastinal and left infra- and supraclavicular lymph nodes (arrows). (B–F) Simulated 75% (75% Sim) (B), 50% (50% Sim) (C), 25% (25% Sim) (D), 12.5% (25% Sim) (E), and 6.25% (6.25% Sim) (F) dose 18F-FDG PET images and (G) corresponding MRI scan obtained with liver acquisition with volume acceleration sequence show increased noise and reduced contrast between tumor (arrows) and liver (arrowheads in G) with simulated reduced radiotracer dose. (H–L) Convolutional neural network (CNN)–augmented low-dose 18F-FDG PET images at 75% (H), 50% (I), 25% (J), 12.5% (K), and 6.25% (L) dose show reduced noise and improved contrast between tumor and liver compared with non-CNN–augmented PET images.
After induction chemotherapy, responders showed equal or lower tumor SUVmax compared with the liver on 100% dose scans, while nonresponders demonstrated higher tumor SUVmax compared with the liver. In scans with simulated reduced radiotracer doses, the tumor SUVmax of all target lesions at baseline (n = 73) and after induction chemotherapy (n = 68) in all 20 patients increased, while the SUVmean of the liver and mediastinal blood pool remained stable (Fig 2, Table E2 [supplement]). Similarly, the image noise measured with the SUV standard deviation of target lesions and liver was higher with reduced simulated doses (Fig E2 [supplement], Table E3 [supplement]). The higher noise in simulated low-dose PET scans changed the visual appearance and quantitative measurements between tumor and reference tissues such that 43% (six of 14) of adequate responders at dose 75%Sim (P = .02), 93% (13 of 14) at dose 50%Sim (P < .001), and 100% (14 of 14) at dose below 50%Sim (P < .001) were upstaged to inadequate responders (Fig 3A).
Figure 2:
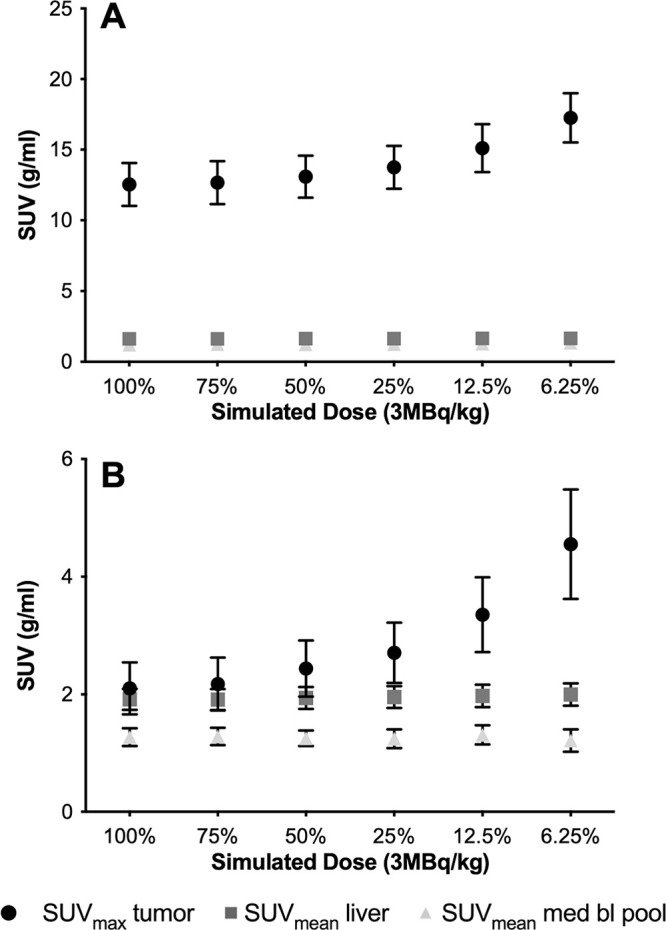
Tumor maximum standardized uptake value (SUVmax) increases with decreasing simulated fluorine 18 (18F) fluorodeoxyglucose (FDG) doses. (A) Baseline scans before therapy. Plot shows mean SUVmax of target tumors (n = 73) and mean standardized uptake values (SUVmean) of liver (n = 20) and mediastinal blood pool (med bl pool) (n = 20) on PET images with decreasing simulated 18F-FDG dose levels. The SUVmax of all target lesions (circle) increases with decreasing 18F-FDG dose levels, while the SUVmean of the liver (square) and mediastinal blood pool (triangle) remains stable. (B) Follow-up scans after induction chemotherapy. Plot shows mean SUVmax of target tumors (n = 68) and SUVmean of liver (n = 20) and mediastinal blood pool (n = 20) on PET images with decreasing simulated 18F-FDG dose levels. For tumors with low metabolic activity, as typically noted after chemotherapy, increasing noise on low-dose images can change the relationship of tumor SUVmax to the SUVmean of reference tissues. Whiskers are 95% CIs.
Figure 3:
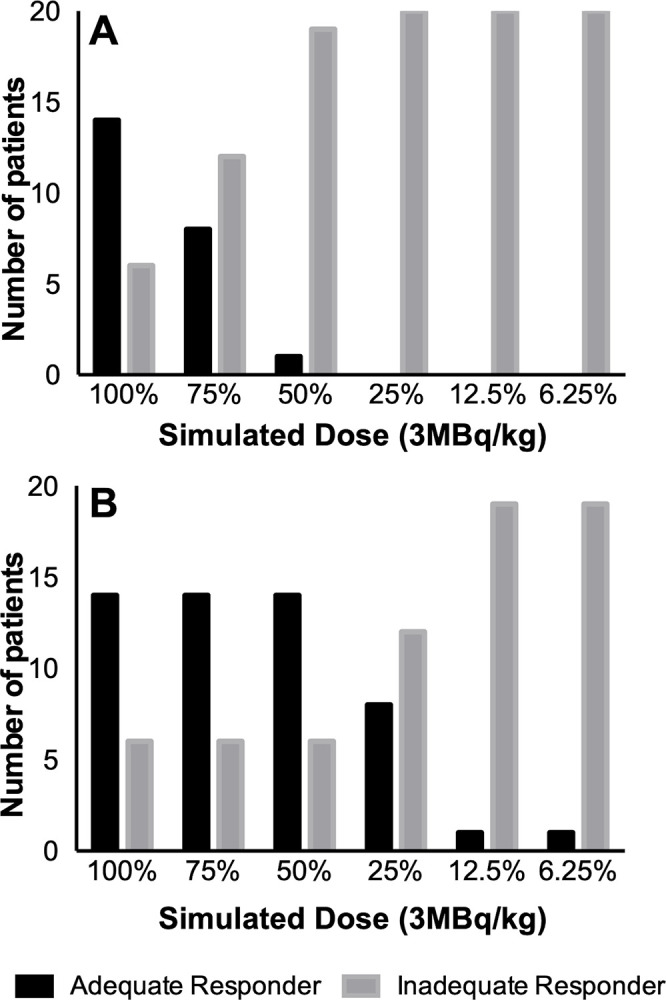
Response status on (A) conventional and (B) deep learning (DL)–enhanced simulated fluorine 18 (18F) fluorodeoxyglucose (FDG) PET scans. (A) Bar chart shows that reducing the radiotracer dose to less than or equal to 75% leads to a significant underestimation of tumor therapy response and erroneous upstaging of adequate responders to inadequate responders on simulated reduced-dose 18F-FDG PET images (P < .05). (B) Bar chart shows that simulated dose reduction with DL-enhanced 18F-FDG PET scans enables dose reduction up to 50% with correct therapy response assessment of all patients.
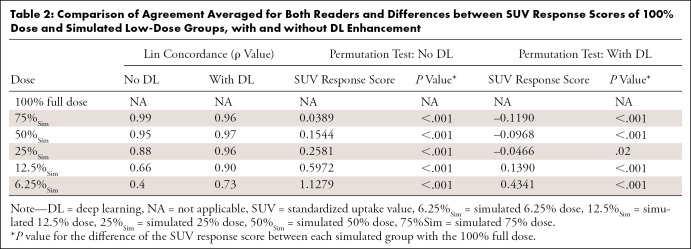
Lin concordance correlation coefficients to measure the agreement of SUV response scores after induction chemotherapy between simulated low-dose and full-dose scans for reader 1 and reader 2, respectively, were 0.99 and 0.99 (75% dose), 0.96 and 0.95 (50% dose), 0.87 and 0.90 (25% dose), 0.66 and 0.67 (12.5% dose), and 0.39 and 0.42 (6.25% dose) (Table 2). A permutation test showed significant differences in SUV response scores for all low-dose groups compared with the 100% dose group (P < .001) (Table 2).
Table 2:
Comparison of Agreement Averaged for Both Readers and Differences between SUV Response Scores of 100% Dose and Simulated Low-Dose Groups, with and without DL Enhancement
CNN Augmentation of Simulated Low-Dose PET/MRI Scans Enabled More Accurate Tumor SUV Measurements
To correct the errors in upstaging adequate responders, we applied a commercially available DL CNN for augmentation of 18F-FDG PET data to improve image assessment of lesion response. The DL-augmented images showed reduced noise and improved tumor-to-liver contrast compared with their nonaugmented counterparts (Fig 1). Lin concordance correlation coefficients between SUV response scores of CNN-augmented low-dose and full-dose scans for readers 1 and 2, respectively, were 0.95 and 0.96 (75%Sim), 0.97 and 0.97 (50%Sim), 0.96 and 0.96 (25%Sim), 0.90 and 0.91 (12.5%Sim), and 0.78 and 0.68 (6.25%Sim) (Table 2). Significant differences in SUV response scores for DL-enhanced low-dose scans compared with the 100% full-dose group were observed for all dose groups (P < .001) except dose 25%Sim (P = .02) (Table 2).
CNN-augmented Low-Dose PET/MRI Scans Enable Tumor Therapy Response Assessments
On 100% dose follow-up scans, the SUVmax of the 49 target tumors from the 14 adequate responders (mean, 1.5 ± 0.4) was lower than the SUVmean of the liver (1.9 ± 0.4, P < .001). The SUVmax of 19 target tumors in six inadequate responders (mean, 3.9 ± 2.9) was higher than the SUVmean of the liver (2.1 ± 0.4, P = .001).
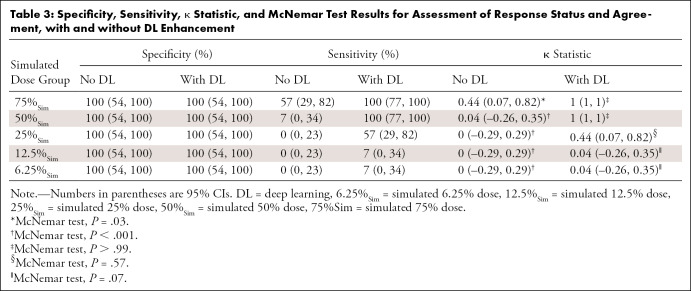
On nonaugmented low-dose scans, the response status of inadequate responders did not change. However, adequate responders were upstaged (Fig 3A) when using the simulated images. Sensitivity and specificity, respectively, were 57% (95% CI: 29, 82) and 100% (95% CI: 54, 100) for 75%Sim and 7% (95% CI: 0, 34) and 100% (95% CI: 54, 100) for 50%Sim. The 25%Sim, 12.5%Sim, and 6.25%Sim images all had the same values, with 0% sensitivity (95% CI: 0, 23) and 100% specificity (95% CI: 54, 100) (Table 3).
Table 3:
Specificity, Sensitivity, κ Statistic, and McNemar Test Results for Assessment of Response Status and Agreement, with and without DL Enhancement
Tumor therapy response assessments based on CNN-augmented PET images with 75%Sim and 50%Sim 18F-FDG dose enabled correct diagnoses for all patients (ie, reviewer-based diagnoses of adequate or inadequate response were identical for 100% dose PET scans, CNN-augmented 75%Sim dose scans, and CNN-augmented 50%Sim dose scans for both readers) (Figs 3B–E3 [supplement]), with sensitivity of 100% (95% CI: 77, 100) and specificity of 100% (95% CI: 54, 100). CNN-enhanced PET scans demonstrated an increasing error for 18F-FDG doses of less than 50%Sim (Fig E4 [supplement]); sensitivity and specificity, respectively, were 57% (95% CI: 29, 82) and 100% (95% CI: 54, 100) for 25%Sim dose and 7% (95% CI: 0, 34) and 100% (95% CI: 54, 100) for both 12.5%Sim and 6.25%Sim dose (Table 3).
Discussion
Our data show that a DL CNN may enable low-dose 18F-FDG PET/MRI of patients with lymphoma. Tumor therapy response assessments based on CNN-augmented PET/MRI scans with simulated 75% and 50% 18F-FDG dose enabled correct diagnoses of all patients.
Several investigators reported that replacing CT with MRI for anatomic coregistration of 18F-FDG PET data can reduce patient exposure by 70%–80% (7,9). A clinical standard 18F-FDG PET/CT in children is associated with about 4–7 mSv of radiation exposure for PET (28,29) and up to 20 mSv for CT (28); however, newer CT protocols for children can reduce the radiation exposure from CT to 1.77 mSv (29). Therefore, radiation exposure from PET can be higher than that from CT and warrants further research in 18F-FDG dose reductions. The North American Consensus Guidelines for Pediatric Nuclear Medicine suggest an 18F-FDG dose of 3.7–5.2 MBq/kg (0.1–0.14 mCi/kg) for clinical 18F-FDG PET/CT (30). To our knowledge, a dose threshold for 18F-FDG PET/MRI studies has not yet been determined. Several recent studies suggest that the longer image data acquisition during PET/MRI scanning enables administration of reduced radiotracer doses (10–13,21). In a study of adult patients with solid cancers, Behr et al (10) reported that a seven-times reduced 18F-FDG dose for time-of-flight PET/MRI provided better visual image quality compared with non-time-of-flight PET/CT. Seith et al (13) reported successful whole-body PET scans of adults with cancer after reducing the dose to 2 MBq/kg 18F-FDG (which is similar to the 75%Sim dose group in our study). In studies of pediatric patients, Gatidis et al (11) and Zuchetta et al (21) reported that a dose reduction of 18F-FDG from 3 MBq/kg to 1.5 MBq/kg body weight did not significantly affect the detection of solid tumors. Although lower 18F-FDG radiotracer doses on PET/MRI scans can be used for tumor staging, none of these previous studies evaluated the effect of lower 18F-FDG radiotracer doses on tumor therapy response assessment. Our study adds the important finding that 18F-FDG dose reductions, when simulated, can impact cancer therapy response assessment. That is, low-dose scans can change the perceived relationship between the tumor and liver PET signal, which in turn can lead to misclassification of adequate responders.
Accurate response assessment after induction chemotherapy for pediatric patients with lymphoma is crucial for further treatment stratification. In most treatment protocols for classic Hodgkin lymphoma, response assessment after two cycles of chemotherapy helps determine the therapeutic regimen (either consolidation chemotherapy or escalated chemotherapy and radiation therapy). In children and young adults, radiation therapy is avoided as much as possible to prevent the risk of developing secondary malignancies. Previous studies of low- and intermediate-risk Hodgkin lymphoma have shown that omitting radiation therapy for complete responders after induction chemotherapy led to a high rate of event-free survival (31,32). In an ongoing clinical trial (ClinicalTrials.gov identifier: NCT03755804) evaluating low-, intermediate-, and high-risk classic Hodgkin lymphoma, additional residual node radiation therapy is used only in patients who did not demonstrate adequate response after two cycles of chemotherapy. In our study, DL-enhanced PET scans with 50% simulated reduced radiotracer dose provided equal treatment response assessments compared with 100% dose scans.
The sensitivity for correct treatment response assessment for DL-enhanced 25% dose scans was not perfect. Therefore, we recommend the assessment of a 50% dose reduction with the use of the DL CNN for improved image quality. Further study would allow validation that the use of a DL CNN on reduced-dose images would avoid erroneous upstaging. In addition, this lower radiotracer dose would reduce radiation exposure to the patient. Another approach to further reduce radiation dose while maintaining image quality would be to decrease the FDG dose while simultaneously increasing the PET acquisition time. However, PET of children cannot be too time-consuming, and our protocol has been shown to provide cancer staging scans in less than 1 hour (7,33).
While 50% dose reduction is just a first step with an already commercially available DL CNN, future artificial intelligence algorithms must further lower the FDG dose without affecting image quality. A novel artificial intelligence algorithm recently developed in our laboratory enabled a dose reduction to as low as 6.25% of the original dose while maintaining image quality (34). Similarly, other DL algorithms for PET denoising have mostly evaluated the image quality through quantitative metrics such as peak signal-to-noise ratio and structural similarity (35–38), which have been shown to have a lower discordance with clinically useful metrics (39). Our proposed method has been shown to maintain lesion conspicuity as well as SUV accuracy.
We observed that the nonaugmented 75%Sim dose-reduction group had higher agreement of tumor SUV response scores than the CNN-augmented 75%Sim dose group. This is likely owing to the training paradigm of the Food and Drug Administration–approved algorithm that was used. The algorithm was trained in a supervised manner to enhance the quality of low-dose scans at approximately the image quality of one-fourth of the dose as the input scans. In the scenario of the 75%Sim inputs, the input images were of high quality to begin with and likely were out of distribution for the model. This also explains how the performance of the algorithm improved and remained stable while reducing the dose from 75%Sim to 50%Sim as well as 25%Sim, in line with the aforementioned training technique.
DL has been used for a number of medical imaging classification applications, such as detection of retinal disease (40), detection of pneumonia on chest radiographs (41), and estimation of bone age on the basis of hand radiographs (42). Recently, DL has been used for image quality enhancement of MRI scans (43) and dose reduction of a gadolinium-based contrast agent in MRI (44). To date, however, minimizing the radiation exposure of PET/MRI to children with cancer has not been a target of DL. Despite the obvious need for low-dose imaging protocols for pediatric patients, no current strategy has yet used DL to reduce the radiotracer dose in PET/MRI of pediatric patients.
For our study, we used CNNs to improve image quality. CNNs use a variation of multilayer perceptrons with shared-weights architecture and translation invariance characteristics to reconstruct high-level features from incomplete data and have several advantages over standard image reconstructions (45). Compared with traditional analytical approaches, CNNs are more precise, faster, and vendor-independent, and have fewer artifacts (46). One of the major strengths of this study is that the datasets used for evaluating the image enhancement were not used for training the CNN algorithm. This demonstrates the generalizability of the results to external and real-world datasets. Consequently, the proposed method may be used broadly with a lower risk of overfitting on specific datasets obtained from a single institution or vendor.
We did not assess a visual Deauville score. However, for this simulation study we measured SUV of tumors, liver, and mediastinal blood pool to enable quantitative comparisons of the tumor-to-liver contrast, as measured in clinical reports and to assess treatment response status. For our measurements, we selected the largest lesions with the highest metabolic activity for up to six index lesions according to the Lugano criteria for staging and follow-up imaging studies after chemotherapy (20). Because the intended outcome of chemotherapy is to reach background metabolic activity for any given tumor, this goal is most challenging for tumors with high metabolic activity.
We used simulated low-dose PET images by retrospectively unlisting the PET list-mode data and reconstructing them based on the percentage of coincidence events. An alternative approach would have been to inject multiple different PET tracer doses in a single patient; however, this would not be ethically feasible. Previous data have shown that simulated low-dose images have characteristics similar to those of actual low-dose images (47). Therefore, our group and others have used this method to generate low-dose PET images (10–13,21,22,48,49).
Our approach integrates the development of new PET/MRI technologies (7,8) with the use of novel DL methods (45) and, as such, the results from this study have immediate clinical impact. The transition from PET/CT to PET/MRI technologies reduces radiation exposure by replacing CT with radiation-free MRI. As PET/MRI technologies become more widely available, the remaining variable that can further reduce radiation exposure is the administered radiotracer dose. The applied CNN for reconstruction of high-dose images from low-dose data are immediately clinically available and could have an immediate effect on patient care by enabling the implementation of low-dose clinical PET/MRI protocols for pediatric patients with cancer. The DL CNN algorithm could be immediately used by other institutions and applied to other tumor types in children or to PET scans of adult patients. Results can have major and broad effects on health care, as the described DL tool to monitor tumor response with minimal radiation exposure will be readily translatable to the clinic and, ultimately, will help minimize the risk of developing secondary cancer later in life.
Supported in part by grants from the Eunice Kennedy Shriver National Institute of Child Health and Human Development (R01 HD081123) and the Andrew McDonough B+ Foundation. Y.L. supported by the National Institutes of Health (1UL1TR003142).
Disclosures of Conflicts of Interest: A.J.T. No relevant relationships. F.S. No relevant relationships. K.Y. No relevant relationships. A.M.M. No relevant relationships. S.L.S. Pharmaceutical company funding to institution to support clinical trials. A.P. No relevant relationships. M.M. No relevant relationships. Y.L. Grant to institution from Stanford University; paid consultant for Nektar and Gilead; grants to institution from NIH, Merck, and Abeona Therapeutics. Q.Z. No relevant relationships. P.G. Stockholder in and employee of Subtle Medical. A.C. Consulting fee from Subtle Medical, SkopeMR, Chondrometrics, Image Analysis Group, Edge Analytics, and Culvert Engineering; payment for writing and reviewing manuscript from Subtle Medical; paid board member at Brain Key and Chondrometrics; grants/grants pending to institution from GE Healthcare and Philips; money from patent co-ownership from LVIS; stock/stock options in Subtle Medical, LVIS, and Brain Key; travel/accommodations/meeting expenses unrelated to activities listed from Paracelsus Medical Private University (PMU). H.E.D.L. Grant to institution from Andrew MdConough B+ Foundation and National Institutes of Health.
Abbreviations:
- CNN
- convolutional neural network
- DL
- deep learning
- FDG
- fluorodeoxyglucose
- SUV
- standardized uptake value
- SUVmax
- maximum SUV
- SUVmean
- mean SUV
References
- 1. Kleis M, Daldrup-Link H, Matthay K, et al. Diagnostic value of PET/CT for the staging and restaging of pediatric tumors. Eur J Nucl Med Mol Imaging 2009;36(1):23–36. [DOI] [PubMed] [Google Scholar]
- 2. Ahmed BA, Connolly BL, Shroff P, et al. Cumulative effective doses from radiologic procedures for pediatric oncology patients. Pediatrics 2010;126(4):e851–e858. [DOI] [PubMed] [Google Scholar]
- 3. Hong JY, Han K, Jung JH, Kim JS. Association of Exposure to Diagnostic Low-Dose Ionizing Radiation With Risk of Cancer Among Youths in South Korea. JAMA Netw Open 2019;2(9):e1910584. [DOI] [PMC free article] [PubMed] [Google Scholar]
- 4. Mathews JD, Forsythe AV, Brady Z, et al. Cancer risk in 680,000 people exposed to computed tomography scans in childhood or adolescence: data linkage study of 11 million Australians. BMJ 2013;346:f2360. [DOI] [PMC free article] [PubMed] [Google Scholar]
- 5. Meulepas JM, Ronckers CM, Smets AMJB, et al. Radiation Exposure From Pediatric CT Scans and Subsequent Cancer Risk in the Netherlands. J Natl Cancer Inst 2019;111(3):256–263. [Published correction appears in J Natl Cancer Inst. 2018 Oct 1;110(10):1154.] [DOI] [PMC free article] [PubMed] [Google Scholar]
- 6. Pearce MS, Salotti JA, Little MP, et al. Radiation exposure from CT scans in childhood and subsequent risk of leukaemia and brain tumours: a retrospective cohort study. Lancet 2012;380(9840):499–505. [DOI] [PMC free article] [PubMed] [Google Scholar]
- 7. Muehe AM, Theruvath AJ, Lai L, et al. How to Provide Gadolinium-Free PET/MR Cancer Staging of Children and Young Adults in Less than 1 h: the Stanford Approach. Mol Imaging Biol 2018;20(2):324–335. [DOI] [PMC free article] [PubMed] [Google Scholar]
- 8. Daldrup-Link H. How PET/MR Can Add Value For Children With Cancer. Curr Radiol Rep 2017;5(3):15. [DOI] [PMC free article] [PubMed] [Google Scholar]
- 9. Hirsch FW, Sattler B, Sorge I, et al. PET/MR in children. Initial clinical experience in paediatric oncology using an integrated PET/MR scanner. Pediatr Radiol 2013;43(7):860–875. [DOI] [PMC free article] [PubMed] [Google Scholar]
- 10. Behr SC, Bahroos E, Hawkins RA, et al. Quantitative and Visual Assessments toward Potential Sub-mSv or Ultrafast FDG PET Using High-Sensitivity TOF PET in PET/MRI. Mol Imaging Biol 2018;20(3):492–500. [DOI] [PubMed] [Google Scholar]
- 11. Gatidis S, Schmidt H, la Fougère C, Nikolaou K, Schwenzer NF, Schäfer JF. Defining optimal tracer activities in pediatric oncologic whole-body 18F-FDG-PET/MRI. Eur J Nucl Med Mol Imaging 2016;43(13):2283–2289. [DOI] [PubMed] [Google Scholar]
- 12. Lindemann ME, Stebner V, Tschischka A, Kirchner J, Umutlu L, Quick HH. Towards fast whole-body PET/MR: Investigation of PET image quality versus reduced PET acquisition times. PLoS One 2018;13(10):e0206573. [DOI] [PMC free article] [PubMed] [Google Scholar]
- 13. Seith F, Schmidt H, Kunz J, et al. Simulation of Tracer Dose Reduction in 18F-FDG PET/MRI: Effects on Oncologic Reading, Image Quality, and Artifacts. J Nucl Med 2017;58(10):1699–1705. [DOI] [PubMed] [Google Scholar]
- 14. Karakatsanis NA, Fokou E, Tsoumpas C. Dosage optimization in positron emission tomography: state-of-the-art methods and future prospects. Am J Nucl Med Mol Imaging 2015;5(5):527–547. [PMC free article] [PubMed] [Google Scholar]
- 15. Schaefferkoetter JD, Yan J, Sjöholm T, et al. Quantitative Accuracy and Lesion Detectability of Low-Dose 18F-FDG PET for Lung Cancer Screening. J Nucl Med 2017;58(3):399–405. [DOI] [PubMed] [Google Scholar]
- 16. Montravers F, McNamara D, Landman-Parker J, et al. [(18)F]FDG in childhood lymphoma: clinical utility and impact on management. Eur J Nucl Med Mol Imaging 2002;29(9):1155–1165. [DOI] [PubMed] [Google Scholar]
- 17. Depas G, De Barsy C, Jerusalem G, et al. 18F-FDG PET in children with lymphomas. Eur J Nucl Med Mol Imaging 2005;32(1):31–38. [DOI] [PubMed] [Google Scholar]
- 18. Wegner EA, Barrington SF, Kingston JE, et al. The impact of PET scanning on management of paediatric oncology patients. Eur J Nucl Med Mol Imaging 2005;32(1):23–30. [DOI] [PubMed] [Google Scholar]
- 19. Barrington SF, Kluge R. FDG PET for therapy monitoring in Hodgkin and non-Hodgkin lymphomas. Eur J Nucl Med Mol Imaging 2017;44(Suppl 1):97–110. [DOI] [PMC free article] [PubMed] [Google Scholar]
- 20. Cheson BD, Fisher RI, Barrington SF, et al. Recommendations for initial evaluation, staging, and response assessment of Hodgkin and non-Hodgkin lymphoma: the Lugano classification. J Clin Oncol 2014;32(27):3059–3068. [DOI] [PMC free article] [PubMed] [Google Scholar]
- 21. Zucchetta P, Branchini M, Zorz A, et al. Quantitative analysis of image metrics for reduced and standard dose pediatric 18F-FDG PET/MRI examinations. Br J Radiol 2019;92(1095):20180438. [DOI] [PMC free article] [PubMed] [Google Scholar]
- 22. Sekine T, Delso G, Zeimpekis KG, et al. Reduction of 18F-FDG Dose in Clinical PET/MR Imaging by Using Silicon Photomultiplier Detectors. Radiology 2018;286(1):249–259. [DOI] [PubMed] [Google Scholar]
- 23. Ronneberger O, Fischer P, Brox T. U-Net: Convolutional Networks for Biomedical Image Segmentation. In: Navab N, Hornegger J, Wells W, Frangi A, eds.Medical Image Computing and Computer-Assisted Intervention – MICCAI 2015. MICCAI 2015. Lecture Notes in Computer Science, vol 9351. Cham, Switzerland:Springer, 2015;234–241. [Google Scholar]
- 24. Xu J, Gong E, Pauly JM, Zaharchuk G. 200x Low-dose PET Reconstruction using Deep Learning. arXiv 1712.04119 [preprint]. https://arxiv.org/abs/1712.04119. Posted December 12, 2017. Accessed August 12, 2020.
- 25. Chaudhari AS, Mittra E, Davidzon GA, et al. Low-count whole-body PET with deep learning in a multicenter and externally validated study. NPJ Digit Med 2021;4(1):127. [Published correction appears in NPJ Digit Med 2021;4(1):139.] [DOI] [PMC free article] [PubMed] [Google Scholar]
- 26. McHugh ML. Interrater reliability: the kappa statistic. Biochem Med (Zagreb) 2012;22(3):276–282. [PMC free article] [PubMed] [Google Scholar]
- 27. Lin LI. A concordance correlation coefficient to evaluate reproducibility. Biometrics 1989;45(1):255–268. [PubMed] [Google Scholar]
- 28. Chawla SC, Federman N, Zhang D, et al. Estimated cumulative radiation dose from PET/CT in children with malignancies: a 5-year retrospective review. Pediatr Radiol 2010;40(5):681–686. [DOI] [PMC free article] [PubMed] [Google Scholar]
- 29. Fahey FH, Goodkind A, MacDougall RD, et al. Operational and Dosimetric Aspects of Pediatric PET/CT. J Nucl Med 2017;58(9):1360–1366. [DOI] [PMC free article] [PubMed] [Google Scholar]
- 30. Gelfand MJ, Parisi MT, Treves ST;. Pediatric Nuclear Medicine Dose Reduction Workgroup. Pediatric radiopharmaceutical administered doses: 2010 North American consensus guidelines. J Nucl Med 2011;52(2):318–322. [DOI] [PubMed] [Google Scholar]
- 31. Metzger ML, Weinstein HJ, Hudson MM, et al. Association between radiotherapy vs no radiotherapy based on early response to VAMP chemotherapy and survival among children with favorable-risk Hodgkin lymphoma. JAMA 2012;307(24):2609–2616. [DOI] [PMC free article] [PubMed] [Google Scholar]
- 32. Friedman DL, Chen L, Wolden S, et al. Dose-intensive response-based chemotherapy and radiation therapy for children and adolescents with newly diagnosed intermediate-risk hodgkin lymphoma: a report from the Children’s Oncology Group Study AHOD0031. J Clin Oncol 2014;32(32):3651–3658. [DOI] [PMC free article] [PubMed] [Google Scholar]
- 33. Theruvath AJ, Siedek F, Muehe AM, et al. Therapy Response Assessment of Pediatric Tumors with Whole-Body Diffusion-weighted MRI and FDG PET/MRI. Radiology 2020;296(1):143–151. [DOI] [PMC free article] [PubMed] [Google Scholar]
- 34. Wang YJ, Baratto L, Hawk KE, et al. Artificial intelligence enables whole-body positron emission tomography scans with minimal radiation exposure. Eur J Nucl Med Mol Imaging 2021;48(9):2771–2781. [DOI] [PMC free article] [PubMed] [Google Scholar]
- 35. Kaplan S, Zhu YM. Full-Dose PET Image Estimation from Low-Dose PET Image Using Deep Learning: a Pilot Study. J Digit Imaging 2019;32(5):773–778. [DOI] [PMC free article] [PubMed] [Google Scholar]
- 36. Kang J, Gao Y, Shi F, Lalush DS, Lin W, Shen D. Prediction of standard-dose brain PET image by using MRI and low-dose brain [18F]FDG PET images. Med Phys 2015;42(9):5301–5309. [DOI] [PMC free article] [PubMed] [Google Scholar]
- 37. Chen KT, Gong E, de Carvalho Macruz FB, et al. Ultra-Low-Dose 18F-Florbetaben Amyloid PET Imaging Using Deep Learning with Multi-Contrast MRI Inputs. Radiology 2019;290(3):649–656. [Published correction appears in Radiology 2020;296(3):E195.] [DOI] [PMC free article] [PubMed] [Google Scholar]
- 38. Wang Y, Yu B, Wang L, et al. 3D conditional generative adversarial networks for high-quality PET image estimation at low dose. Neuroimage 2018;174:550–562. [DOI] [PMC free article] [PubMed] [Google Scholar]
- 39. Knoll F, Murrell T, Sriram A, et al. Advancing machine learning for MR image reconstruction with an open competition: Overview of the 2019 fastMRI challenge. Magn Reson Med 2020;84(6):3054–3070. [DOI] [PMC free article] [PubMed] [Google Scholar]
- 40. Kermany DS, Goldbaum M, Cai W, et al. Identifying Medical Diagnoses and Treatable Diseases by Image-Based Deep Learning. Cell 2018;172(5):1122–1131.e9. [DOI] [PubMed] [Google Scholar]
- 41. Rajpurkar P, Irvin J, Zhu K, et al. CheXNet: Radiologist-Level Pneumonia Detection on Chest X-Rays with Deep Learning. arXiv 1711.05225 [preprint]. https://arxiv.org/abs/1711.05225. Posted November 14, 2017. Accessed August 12, 2020.
- 42. Larson DB, Chen MC, Lungren MP, Halabi SS, Stence NV, Langlotz CP. Performance of a Deep-Learning Neural Network Model in Assessing Skeletal Maturity on Pediatric Hand Radiographs. Radiology 2018;287(1):313–322. [DOI] [PubMed] [Google Scholar]
- 43. Chaudhari AS, Fang Z, Kogan F, et al. Super-resolution musculoskeletal MRI using deep learning. Magn Reson Med 2018;80(5):2139–2154. [DOI] [PMC free article] [PubMed] [Google Scholar]
- 44. Gong E, Pauly JM, Wintermark M, Zaharchuk G. Deep learning enables reduced gadolinium dose for contrast-enhanced brain MRI. J Magn Reson Imaging 2018;48(2):330–340. [DOI] [PubMed] [Google Scholar]
- 45. Banerjee I, Crawley A, Bhethanabotla M, Daldrup-Link HE, Rubin DL. Transfer learning on fused multiparametric MR images for classifying histopathological subtypes of rhabdomyosarcoma. Comput Med Imaging Graph 2018;65:167–175. [DOI] [PubMed] [Google Scholar]
- 46. Daldrup-Link H. Artificial intelligence applications for pediatric oncology imaging. Pediatr Radiol 2019;49(11):1384–1390. [DOI] [PMC free article] [PubMed] [Google Scholar]
- 47. Gatidis S, Würslin C, Seith F, et al. Towards tracer dose reduction in PET studies: Simulation of dose reduction by retrospective randomized undersampling of list-mode data. Hell J Nucl Med 2016;19(1):15–18. [DOI] [PubMed] [Google Scholar]
- 48. Shkumat NA, Vali R, Shammas A. Clinical evaluation of reconstruction and acquisition time for pediatric 18F-FDG brain PET using digital PET/CT. Pediatr Radiol 2020;50(7):966–972. [DOI] [PubMed] [Google Scholar]
- 49. Rauscher I, Fendler WP, Hope TA, et al. Can the Injected Dose Be Reduced in 68Ga-PSMA-11 PET/CT While Maintaining High Image Quality for Lesion Detection? J Nucl Med 2020;61(2):189–193. [DOI] [PMC free article] [PubMed] [Google Scholar]


