
Figure 2:
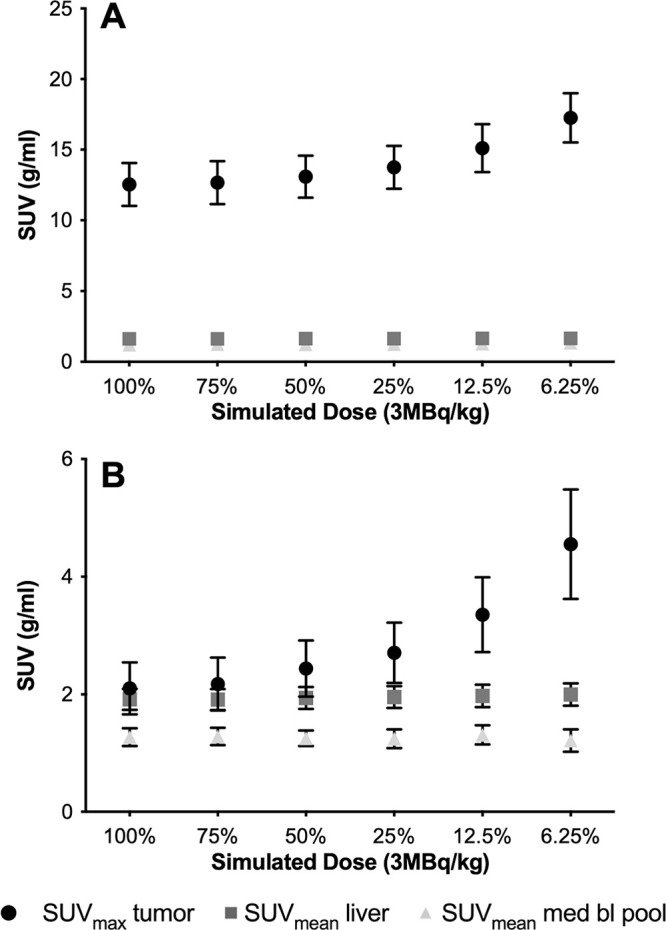
Tumor maximum standardized uptake value (SUVmax) increases with decreasing simulated fluorine 18 (18F) fluorodeoxyglucose (FDG) doses. (A) Baseline scans before therapy. Plot shows mean SUVmax of target tumors (n = 73) and mean standardized uptake values (SUVmean) of liver (n = 20) and mediastinal blood pool (med bl pool) (n = 20) on PET images with decreasing simulated 18F-FDG dose levels. The SUVmax of all target lesions (circle) increases with decreasing 18F-FDG dose levels, while the SUVmean of the liver (square) and mediastinal blood pool (triangle) remains stable. (B) Follow-up scans after induction chemotherapy. Plot shows mean SUVmax of target tumors (n = 68) and SUVmean of liver (n = 20) and mediastinal blood pool (n = 20) on PET images with decreasing simulated 18F-FDG dose levels. For tumors with low metabolic activity, as typically noted after chemotherapy, increasing noise on low-dose images can change the relationship of tumor SUVmax to the SUVmean of reference tissues. Whiskers are 95% CIs.