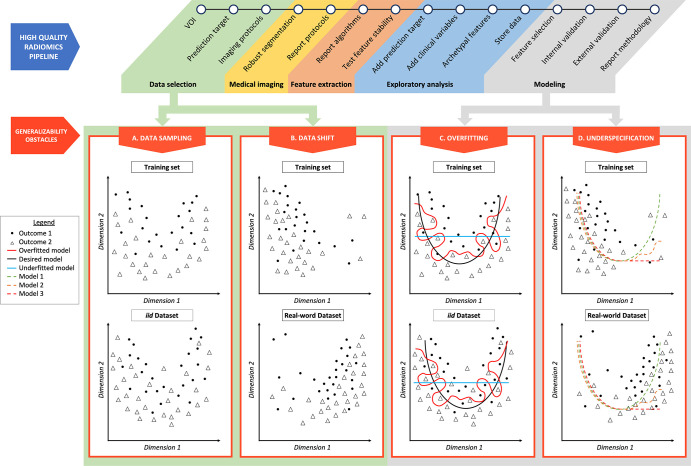
Figure 1:
Radiomics pipeline examples of overfitting and underspecification. A high-quality radiomics pipeline is shown. Data selection can be affected by data sampling and data shift. Modeling can be biased as a result of overfitting and underspecification. (A) Data sampling. The training set and an independent and identically distributed (iid) dataset are represented, respectively, in the top and bottom figures. Even if following the same distribution, resampling data induces small variations in outcome positions. (B) Data shift. The training dataset and a dataset drawn from the real world are represented, respectively, in the top and bottom figures. Outcomes of low values of dimension 1 are overrepresented in the training set, and outcomes of high values of dimension 1 are overrepresented in the real-world dataset. (C) Overfitting. The red line represents an overfitted model, which is able to isolate every outcome 1 from outcome 2 in the training set. When applied to an iid dataset, its performance deteriorates. The black line represents the desired model, performing identically in a training dataset and in an iid dataset. The blue line represents an underfitted model. (D) Underspecification. Three models (green, orange, and red dotted lines) are trained in a training set in which outcomes of low values of dimension 1 are overrepresented (top figure). These three models fit data well for low values of dimension 1. For high values of dimension 1, models 1 (green dotted line), 2 (orange dotted line), and 3 (red dotted line) behave differently. These three models will perform equally in an iid testing set. However, if the real-world dataset (bottom figure) presents a data shift, characterized by an overrepresentation of dimension 1 high values, model 1 segregates outcomes better than models 2 and 3 and represents the best model regarding generalizability. VOI = volume of interest.

