. 2021 Oct 27;3(6):e210097. doi: 10.1148/ryai.2021210097

Figure 3:

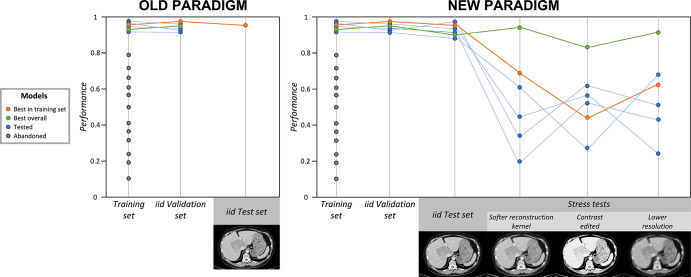
Old and new paradigms: application of stress tests to counteract underspecification. The gray dots indicate models that were abandoned because of their low performance in the training set. The blue dots indicate models that performed well in the training set and were selected to continue to the validation and testing phases. The orange dots indicate the best-performing model in training, in independent and identically distributed (iid) validation, and in iid testing; however, this model performed poorly during stress tests. The green dots indicate the best overall model, which performed well in training, in iid validation, in iid testing, and during stress tests, and is more likely to be the most broadly generalizable model. In the old paradigm (left), after training, the best-performing model in the training set is validated and then tested with iid data. If the performance is satisfying, the model is deployed. In the new paradigm (right), six models (blue, orange, and green dots and lines) trained on the same training set are selected for validation and testing. After iid validation and iid testing, their performances are assessed by using three stress tests, designed with artificially modified CT scans, with the application of blurring and pixelating filters, and with contrast modification. All six models show great accuracy in the iid validation and iid test sets, but the green model is the only one that performs well throughout all stress tests. Therefore, the green model is the one that is the most likely to broadly generalize well (ie, to maintain high performance even when applied to shifted datasets). Adding stress tests to the pipeline allowed the green model to be distinguished from others.

Old and new paradigms: application of stress tests to counteract underspecification. The gray dots indicate models that were abandoned because of their low performance in the training set. The blue dots indicate models that performed well in the training set and were selected to continue to the validation and testing phases. The orange dots indicate the best-performing model in training, in independent and identically distributed (iid) validation, and in iid testing; however, this model performed poorly during stress tests. The green dots indicate the best overall model, which performed well in training, in iid validation, in iid testing, and during stress tests, and is more likely to be the most broadly generalizable model. In the old paradigm (left), after training, the best-performing model in the training set is validated and then tested with iid data. If the performance is satisfying, the model is deployed. In the new paradigm (right), six models (blue, orange, and green dots and lines) trained on the same training set are selected for validation and testing. After iid validation and iid testing, their performances are assessed by using three stress tests, designed with artificially modified CT scans, with the application of blurring and pixelating filters, and with contrast modification. All six models show great accuracy in the iid validation and iid test sets, but the green model is the only one that performs well throughout all stress tests. Therefore, the green model is the one that is the most likely to broadly generalize well (ie, to maintain high performance even when applied to shifted datasets). Adding stress tests to the pipeline allowed the green model to be distinguished from others.