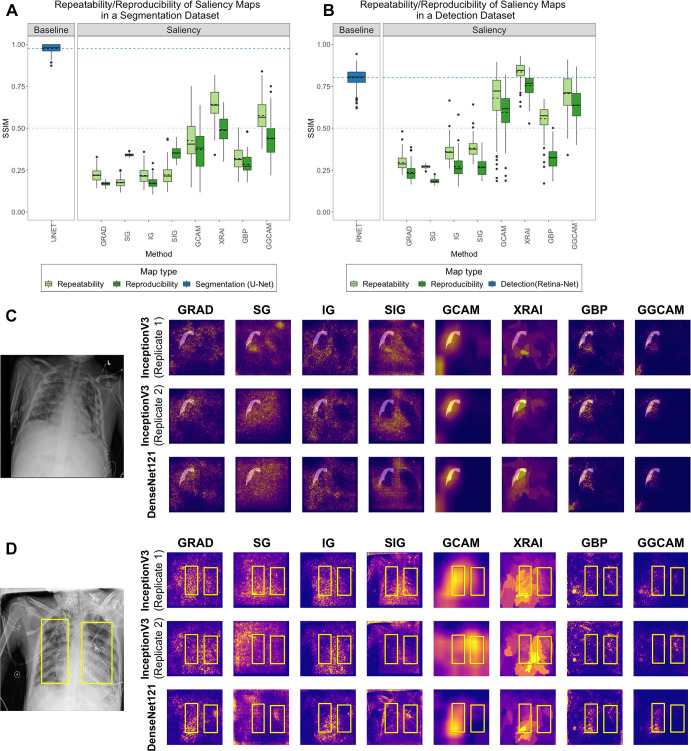
Figure 4:
Comparison of repeatability and reproducibility scores for all saliency methods for (A) SIIM-ACR Pneumothorax Segmentation dataset and (B) RSNA Pneumonia Detection Challenge dataset. Each box plot represents the distribution of scores across the test datasets for each saliency map, with a solid line denoting the median and a dashed line denoting the mean. Results are compared with a low baseline of SSIM = 0.5 (light blue dashed line) and high baseline using U-Net or RetinaNet (dark blue box plot and dashed line). Two examples of repeatability (InceptionV3 replicates 1 and 2) and reproducibility (InceptionV3 and DenseNet-121) for the (C) SIIM-ACR pneumothorax dataset with transparent segmentations and (D) RSNA pneumonia dataset with yellow bounding boxes. The first two rows of (C) and (D) are saliency maps generated from two separately trained InceptionV3 models (replicates 1 and 2) to demonstrate repeatability, and the last row are saliency maps generated by DenseNet-121 to demonstrate reproducibility. GBP = guided backpropagation, GCAM = gradient-weighted class activation mapping, GGCAM = guided GCAM, GRAD = gradient explanation, IG = integrated gradients, RSNA = Radiological Society of North America, SG = Smoothgrad, SIG = smooth IG, SIIM = Society for Imaging Informatics in Medicine, SSIM = structural similarity index measure.

