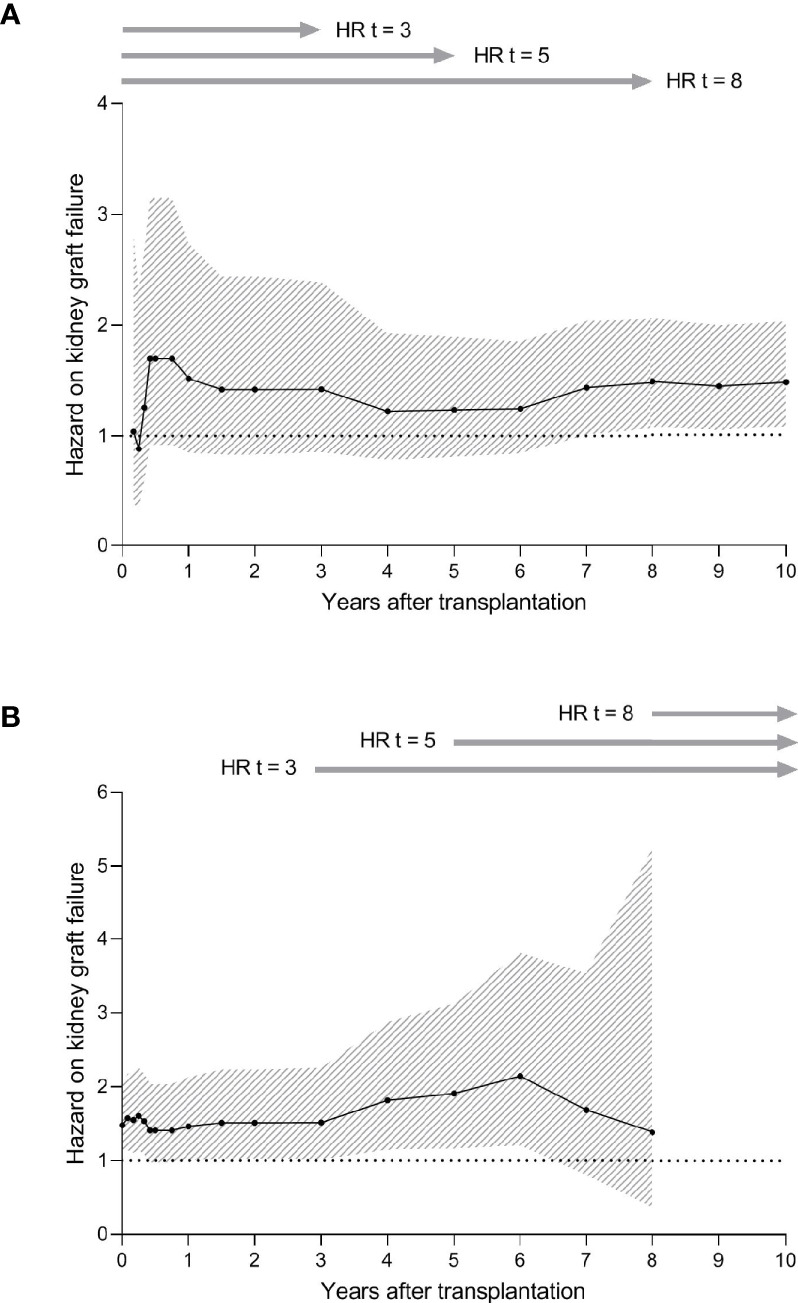
Figure 5.

Hazard ratios (HRs) and 95% confidence intervals (CIs) for the effect of the Shared T-cell Epitopes (STEP) score on death-censored kidney graft failure. (A) HRs and 95% CIs for the STEP score on death-censored kidney graft failure at different virtual endpoints after transplantation (2-3-4-5-6-9-12-18 months and 2-3-4-5-6-7-8-9-10 years after transplantation). For all time spans, the number of recipients included in the analysis is 190. Due to the low number of events at 1 month transplantation, the HRs for this time span could not be calculated. (B) HRs and 95% CIs for the STEP score on death-censored kidney graft failure among patients who did not experience graft failure before different time points (1-2-3-4-5-6-9-12-18 months and 2-3-4-5-6-7-8 years after transplantation). These analyses were performed by setting the graft survival to 100% at each time point and by consequently calculating the HR and 96% CIs at 10 years after transplantation. The number of recipients at risk for each time span is shown in Supplementary Table 4 . Due to the low number of events at 9 and 10 years after transplantation, the HRs for these time spans could not be calculated. HRs were calculated considering the covariates implemented in the initial multivariable model (STEP score). For both graphs, the black line represents the HR and the grey area represents the 95% CI.
