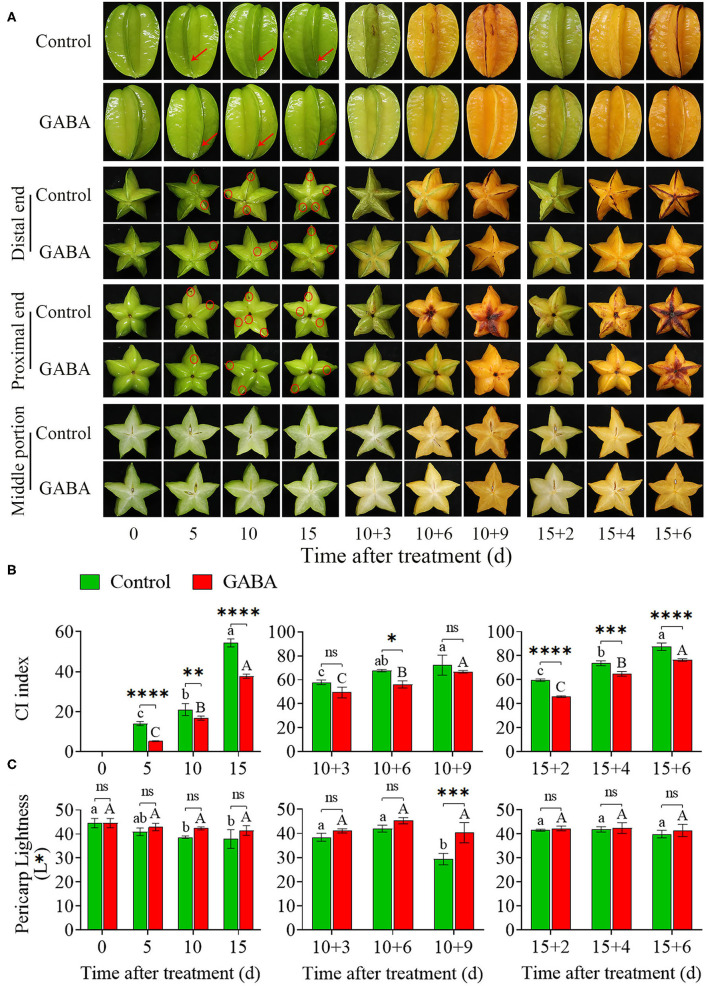
Figure 1.
Visual appearance of CI symptoms of carambola fruit during storage at 4 and 25°C (A), CI index (B), and pericarp lightness (C). Error bars are expressed as means ± SD (standard deviation) of three replicates (n = 3). The asterisks indicate statistically significant differences between treatments at *p < 0.05, **p < 0.01, ***p < 0.001, ****p < 0.0001, ns, no significant.

