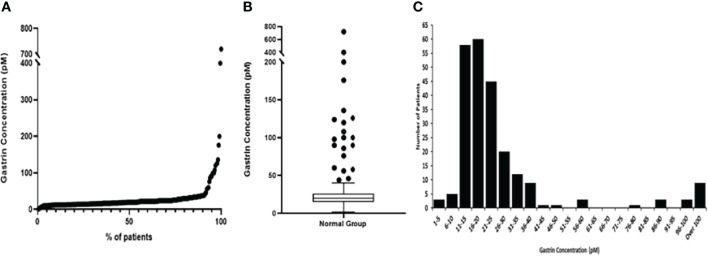
Figure 2.
Graphs representing fasting serum gastrin concentrations (pM) in the normal group of patients. (A) Scatter graph showing the fasting serum gastrin concentrations (pM) from minimum to maximum values (B) Box and Whisker plot, showing the median gastrin concentration, plotted using the Tukey method (C) Histogram showing the spread of results.

