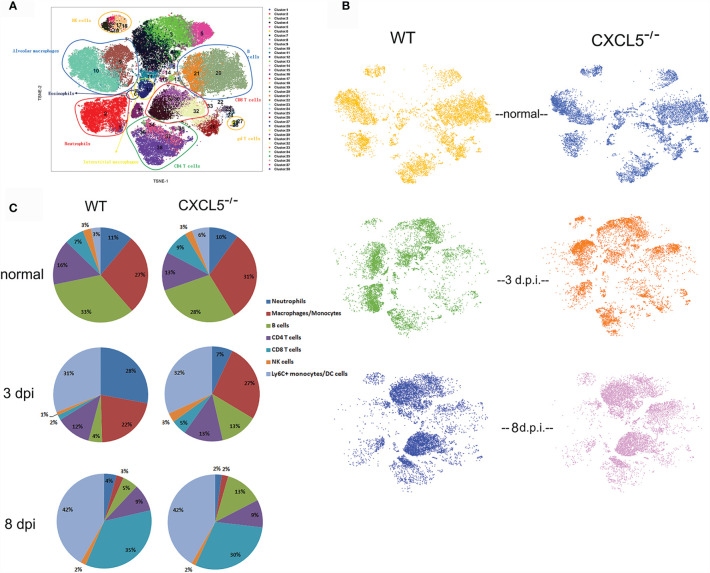
Figure 4.
CyTOF analysis and comparison of leukocyte compositions in WT and CXCL5-/- mouse lungs before and after influenza infection. (A) tSNE analysis of CD45+ single-cell data from the mouse lung tissues. The cells were plotted and color-coded according to 38 clusters using the X-shift clustering algorithm. The detailed characterization of each cluster is shown in Supplemental Figure 2 . The different cell subsets were divided by their surface marker expression patterns in normal mouse lungs as described previously (18). (B) tSNE analysis of the leukocyte compositions of lung tissues derived from WT and CXCL5-/- mice (n=1) before and after (at 3 d.p.i. and 8 d.p.i.) influenza infection. (C) The cell frequencies of the indicated major leukocyte subsets are illustrated for the lungs of WT and CXCL5-/- mice (n=1).

