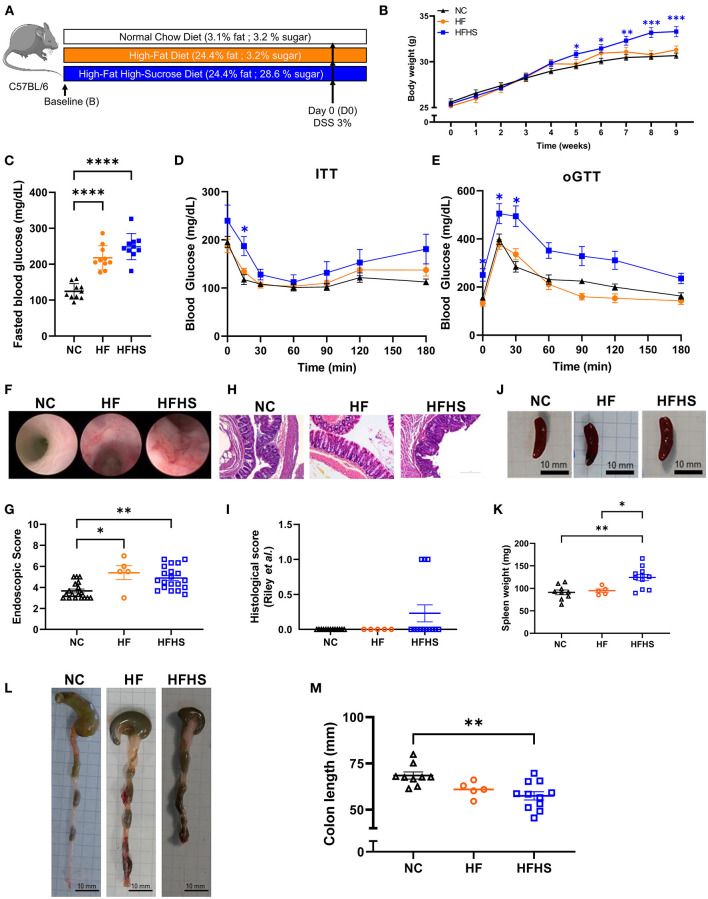
Figure 1.
Additive effects of sucrose and fat in healthy mice. (A) Experimental design. Mice were fed 8 weeks with normal chow diet (NC) or High-Fat (HF) diet or High-Fat High-Sucrose (HFHS). (B) Body weight of HSHF-fed mice (N = 40) was higher than HF-fed mice (N = 10) or NC-fed mice (N = 36). (C) Fasting blood glucose levels in HFHS, HF and NC-fed mice (N = 10 /group). (D) Insulin tolerance test (ITT) after 8 weeks of diet (0.75 U/kg insulin, ip). (E) Oral glucose tolerance test (oGGT) after 8 weeks of diet (2 g/kg per os) for HFHS, HF and NC-fed mice (N = 5/group). (F) Representative colonoscopy images (G) Ulcerative colitis endoscopic index of severity (UCEIS) (H) Representative sections of colon, arrows show epithelial dystrophies. Scale bars, 0.10 mm. (I) Histological scores. (J) Gross pictures of spleens, scale bars: 10 mm. (K) Spleen weight to body weight ratio. (L) Gross pictures of colons. Scale bars, 10 mm. (M) Colon lengths. Data are given as means +/- SEM. *p < 0.05, **p < 0.01, ***p < 0.001, ****p < 0.0001 by ANOVA (two-way for B, D and E) for parametric data or Kruskal-Wallis if not.

