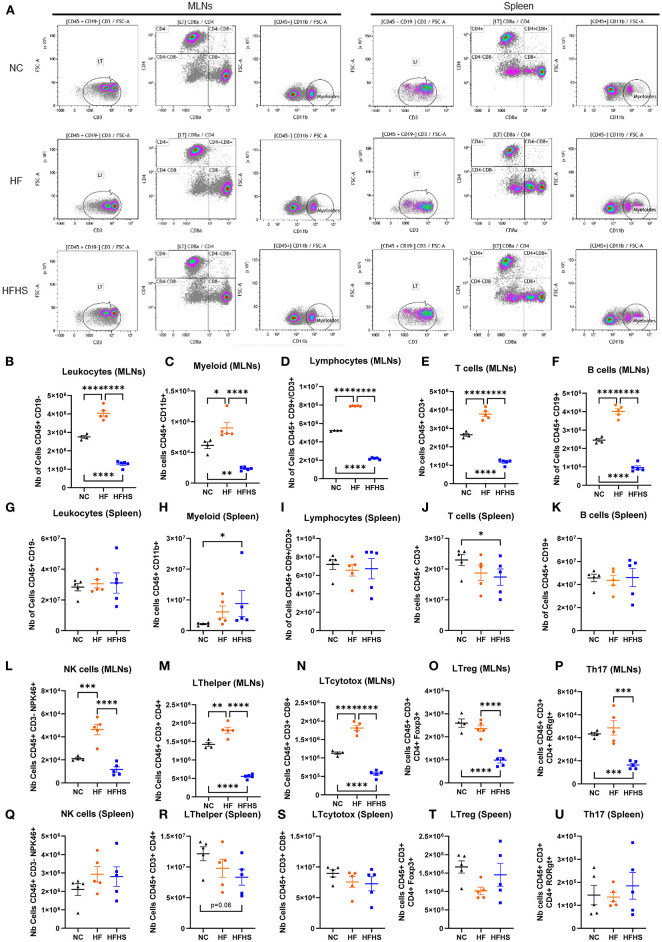
Figure 2.
Sucrose repressed immune cell levels in mesenteric lymph nodes and spleen. (A) Representative flow cytometry recording mesenteric lymph nodes (MLNs) and spleen. (B–U) Relative abundance of indicated immune cell populations MLNs or spleen for mice fed with normal chow diet (NC, N = 5), high-fat diet (HF, N = 5), or high-fat high-sucrose (HFHS, N = 5). Means +/- SEM are plotted. *p < 0.05, **p < 0.01, ***p < 0.001, ****p < 0.0001 by ANOVA for parametric data or Kruskal-Wallis if not.

