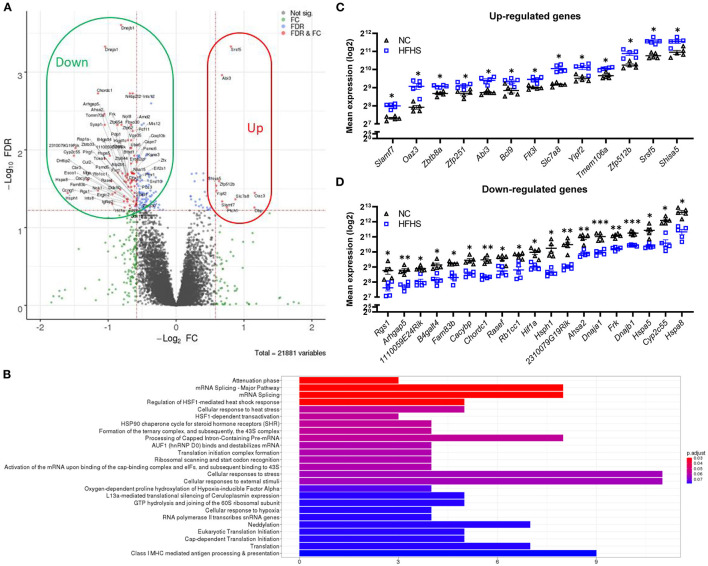
Figure 3.
High-fat high-sucrose diet triggers multiple cellular stress responses on the colonic transcriptome. (A) Volcano plot and (B) Top Reactome pathways of dysregulated genes for HFHS-fed mice (N = 5) vs. NC-fed (N = 5). Statistical analyses identified 154 differentially expressed genes, 86% (132) being under-expressed in HFHS-fed compared to NC-fed mice (FDR < 0.05; fold change > 30%). (C, D) Top dysregulated genes in mice fed a HFHS diet compared with NC diet. Mean expression values (log2) are plotted with standard deviations for up- and down-regulated genes. FDR * ≤ 0.05, ** < 0.01, *** < 0.001.

