Figure 6.
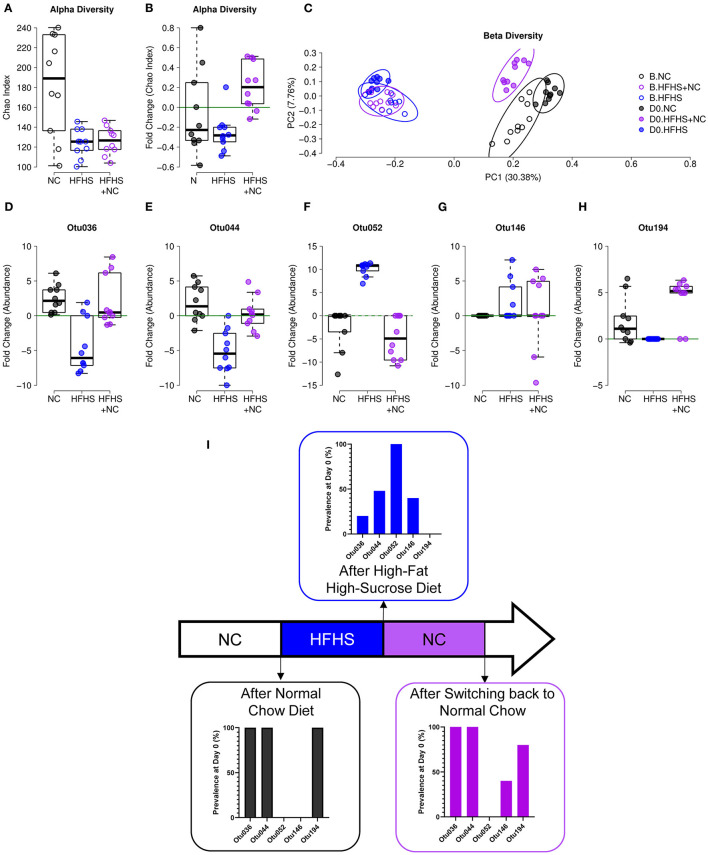
Incomplete recovery of microbiota dysbiosis. (A) α-diversity measured by Chao index of NC-fed, HFHS-fed, or HFHS+NC-fed (N = 10 per group) mice at baseline B. (B) Evolution of species richness measured by a fold change of Chao index at day zero (D0) relative to B. (C) Principal coordinate analysis (PCoA) of Jaccard β-diversity index showing NC-fed, HFHS-fed, or HFHS+NC-fed mice, at B and D0. (D–H) Fold change of abundances at D0 relative to B of the five operational taxonomic units (OTUs) identified as an indicator for diet in the 8-weeks experiment (see Supplementary Figure 6 and EV8). (I) Prevalence of indicated OTUs at D0 after 16 weeks of NC, HFHS, or NC following HFHS.

