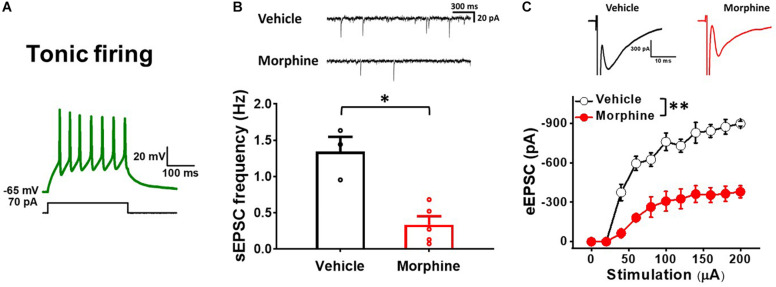
FIGURE 4.
Repeated morphine treatment decreases excitatory synaptic strength in tonic firing neurons in SDH. (A) Representative trace of tonic firing neurons. (B) (top) Representative traces of sEPSC and (bottom) sEPSC frequency (effect size:–3.44, p = 0.018; Vehicle: N = 3, n = 12; Morphine: N = 5, n = 16). ∗p < 0.05 by Welch’s t test. (C) (top) Representative traces of eEPSC and (bottom) Stimulus-responsive curve of eEPSC [F(1,5.92) = 25.56, p = 0.002; Vehicle (N = 4, n = 9); Morphine (N = 3, n = 7)]. ∗∗p < 0.01 vs. vehicle by Sidak’s multiple comparison test following multilevel analysis.

