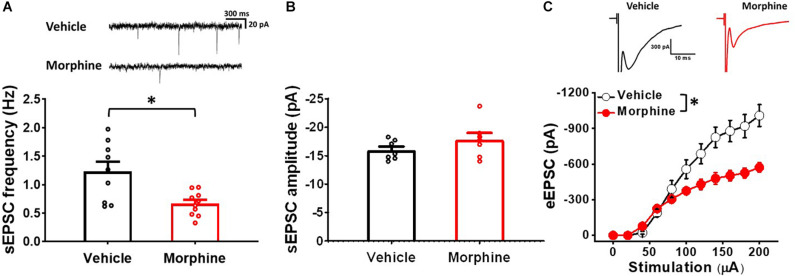
FIGURE 5.
Repeated morphine treatment decreased excitatory synaptic strength in sGABAn. (A) (top) Representative traces of sEPSC and (bottom) sEPSC frequency (effect size:–1.46, p = 0.012; Vehicle: N = 9, n = 143; Morphine: N = 10, n = 123). ∗p < 0.05 by Welch’s t test. (B) sEPSC amplitude (effect size:–0.71, p = 0.214; Vehicle: N = 7, n = 104; Morphine: N = 7, n = 102). (C) (top) Representative traces of eEPSC and (bottom) stimulus-response curve of eEPSC (Figure 5C) [F(1,17.47) = 4.96, p = 0.039; Vehicle (N = 9, n = 32); Morphine (N = 10, n = 87)]. ∗p < 0.05 vs. vehicle by Sidak’s multiple comparison test following multilevel analysis.

