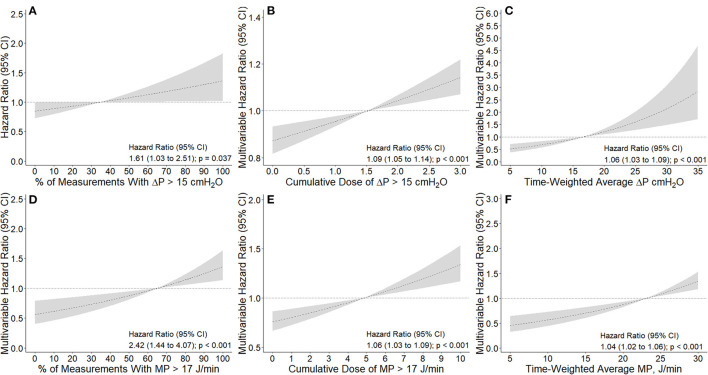
Figure 3.
Association between intensity of exposure to higher driving pressure and mechanical power and 28-day mortality. (A, D): Association between percentage of measurements with ΔP > 15 cmH2O and MP > 17 J/min and 28-day mortality. Percentage calculated from a maximum of 13 measurements extracted every 8 h. (B, E): Association between cumulative dose of ΔP > 15 cmH2O and MP > 17 J/min and 28-day mortality. Cumulative dose calculated as area under the ΔP and MP time curve above the thresholds described above divided by the number of hours of exposure, as a measure of dose. Using this definition, 1 cmH2O or 1 J/min of dose describes that a patient's average ΔP or MP was 1 cmH2O or 1 J/min above the thresholds described for the duration of the exposure window, respectively. (C,F) Association between time-weighted average ΔP and MP and 28-day mortality. Time-weighted average calculated as the area under the ΔP and MP time curve divided by the number of hours of exposure. All models were adjusted for age, gender, body mass index, PaO2 to FiO2 ratio, plasma creatinine, medical history of hypertension, heart failure, diabetes, chronic kidney disease, chronic obstructive pulmonary disease, active hematological neoplasia and/or active solid tumor, use of angiotensin converting enzyme inhibitors, use of angiotensin II receptor blockers, use of a vasopressor or inotropes, fluid balance, arterial pH, mean arterial pressure, and heart rate. Dashed lines and gray areas represent hazard ratio and 95% confidence interval for increasing values the variable analyzed as a continuous variable and centralized in the mean of each variable. ΔP is driving pressure and MP is mechanical power.

