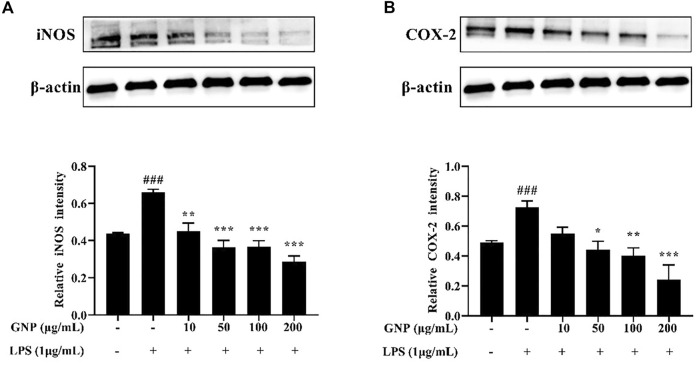
FIGURE 6.
Effect of GNP on iNOS and COX-2 protein levels in LPS-induced RAW 264.7 cells. Cells were treated with GNP (10, 50, 100, and 200 μg/ml) for 2 h and then treated with LPS (1 μg/ml) for 24 h (A) iNOS protein expression and (B) COX-2 protein expression. Data are expressed as mean ± SD (n = 3). (# indicates the significant difference between the LPS group and the blank group, #p < 0.05, ##p < 0.01, ###p < 0.001; * indicates a significant difference between the experimental group and the LPS group, *p < 0.05, **p < 0.01, ***p < 0.001).

