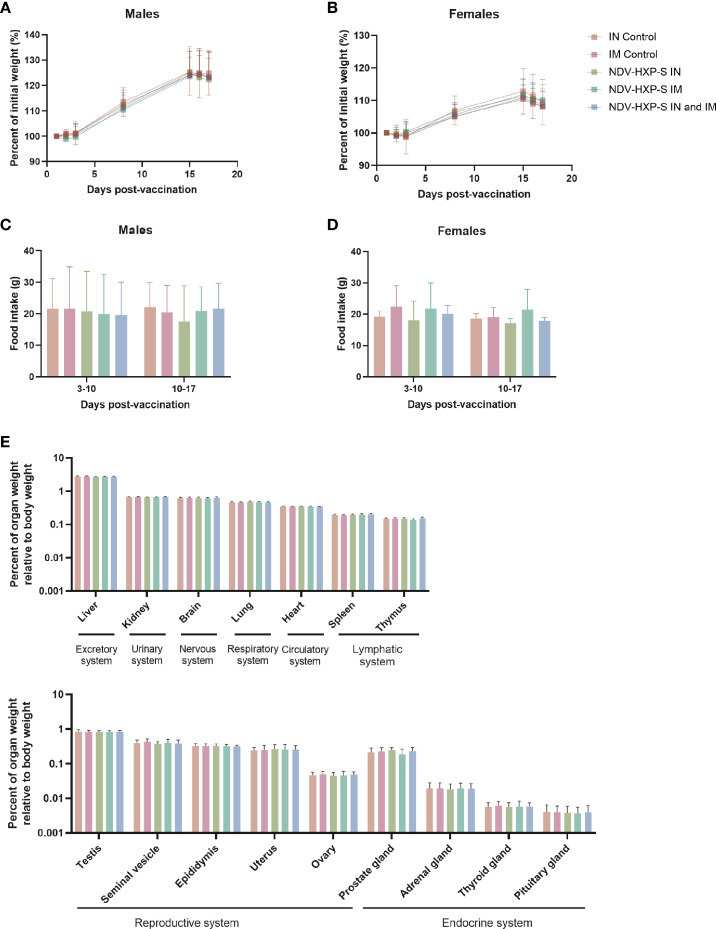
Figure 3.
Clinical and post-mortem evaluations in vaccinated rats. The percentage of initial weight following vaccination of male (A) or female (B) rats is shown. Weight measurements were performed on days 1, 2, 3, 8, 15, 16, and 17 after vaccination. Food consumption was measured daily and averaged over two different periods: 3-10 or 10-17 days after vaccination. The average food intake in males (C) and females (D) is shown. Weight of organs corresponding to excretory, urinary, nervous, respiratory, circulatory, lymphatic, reproductive and endocrine systems are shown (E). Geometric mean with geometric standard deviation (SD) for the IN control, IM control, IN vaccinated, IM vaccinated, and IN-IM vaccinated groups is shown in (A–E). No significant differences between the vaccinated groups and their respective controls were detected.

