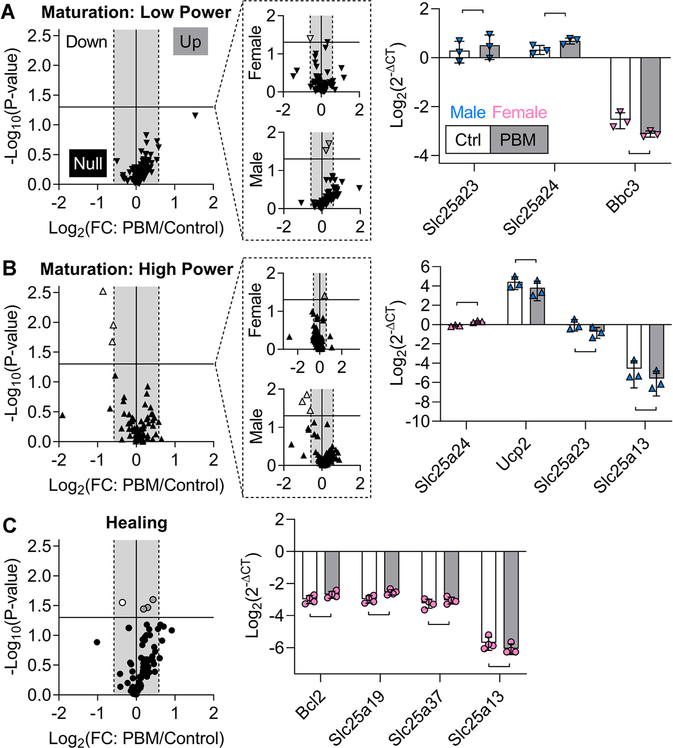
FIGURE 4.
During maturation and healing, mitochondria-related genes were marginally affected by PBM. A-C, Volcano plots of the acute response from mitochondria-related genes after PBM during maturation (A, low and B, high) and healing (C). Volcano plots separated by sex are shown in dashed outcall boxes. Horizontal line: P = .05, gray box: −1.5 to 1.5-fold change. Maturation (low), maturation (high), and healing data points are downward arrowheads, upward arrowheads, and circles, respectively. Data points for downregulated genes are white, upregulated genes are gray, and nonregulated genes are black. For bar graphs, the control (Ctrl) and PBM groups are white and gray bars, and male and female data points are blue and pink, respectively. A, During maturation, low-irradiance PBM significantly downregulated Bbc3 in females and upregulated Slc25a23 and Slc25a24 in males. B, During maturation, high-irradiance PBM downregulated three mitochondria-related genes (Ucp2, Slc25a23, and Slc25a13), and this effect was due to males, not females; only Slc25a24 was significantly upregulated in females. C, During healing, high-irradiance PBM of females statistically upregulated three genes (Bcl2, Slc25a19, and Slc25a37) and downregulated one gene (Slc25a13). Data are presented as mean ± standard deviation. Bars represent significant differences (P < .05). PBM, photobiomodulation

