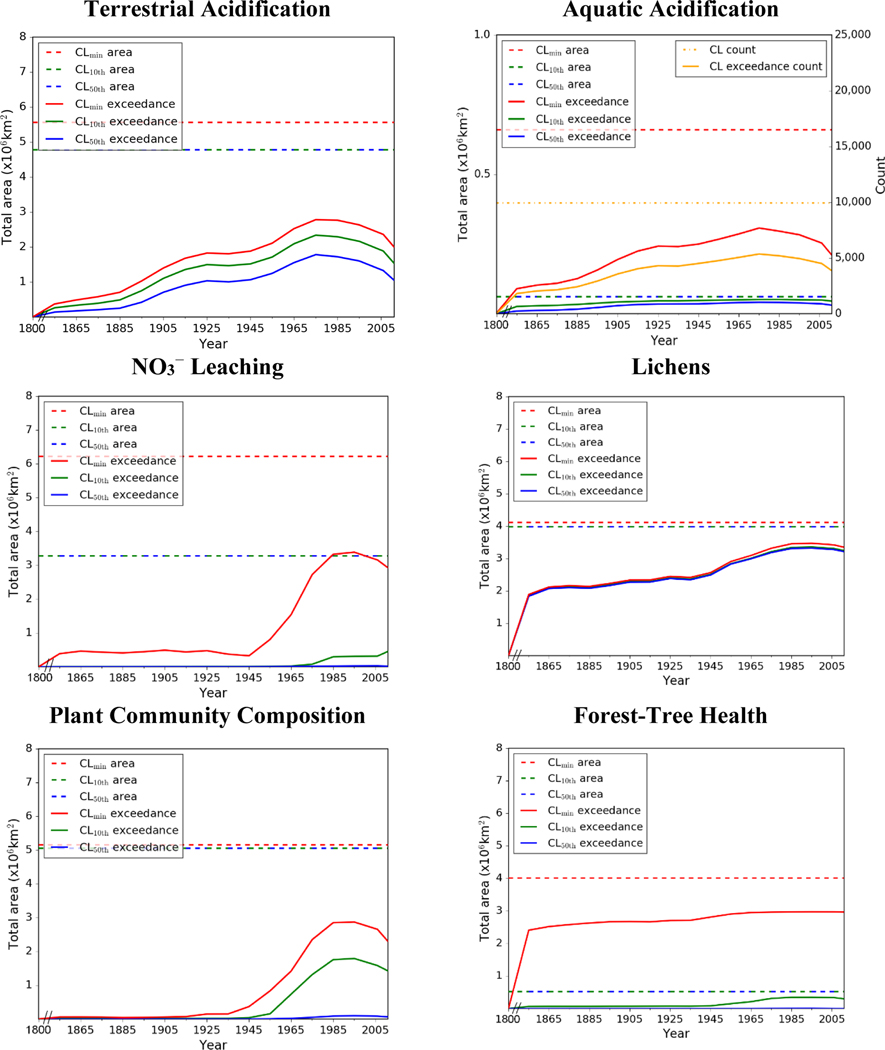
Fig. 5.
Plots of CL exceedances through time (1800–2011) linearly interpolated between decadal midpoints. Areal exceedances (solid lines) for the min (red), 10th percentile (green), and 50th percentile (blue) are shown, along with the total area with data (colored dashed lines). Counts of water bodies with data and exceedances are shown for the Aquatic Acidification CL.

