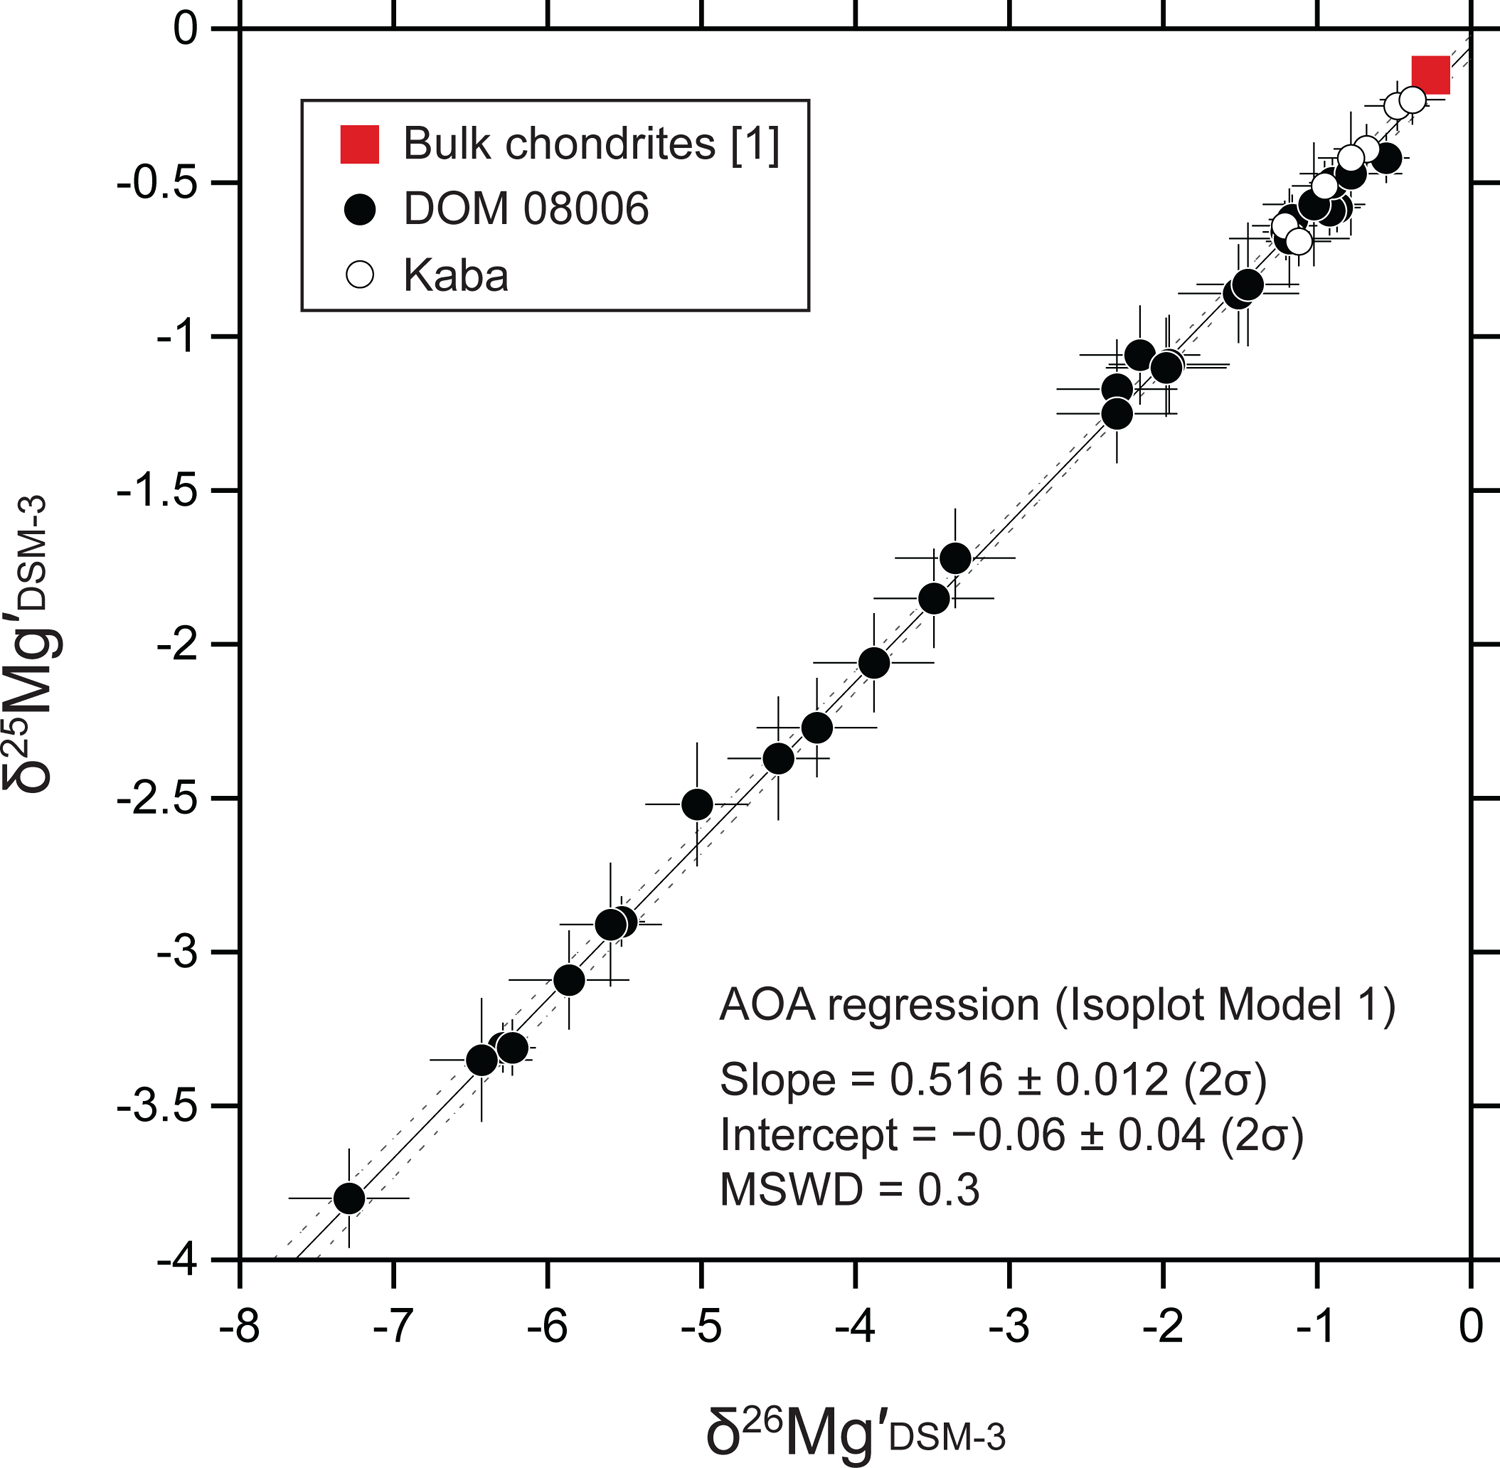
Fig. 8.

Relationships between δ25Mg′DSM-3 and δ26Mg′DSM-3 values of individual AOA olivine analyses. The square symbol represents the Mg isotope ratios of bulk chondrites ([1] Teng et al., 2010). The solid line represents a linear regression line (Isoplot model 1; Ludwig, 2012) for all AOA data (N = 36) obtained in this study. The dotted curves are error envelopes that show 95% confidence limits. Note that uncertainties of δ25Mg′DSM-3 and δ26Mg′DSM-3 values were not propagated from those related to instrumental mass fractionation. See more details in Electronic Annex EA5.
