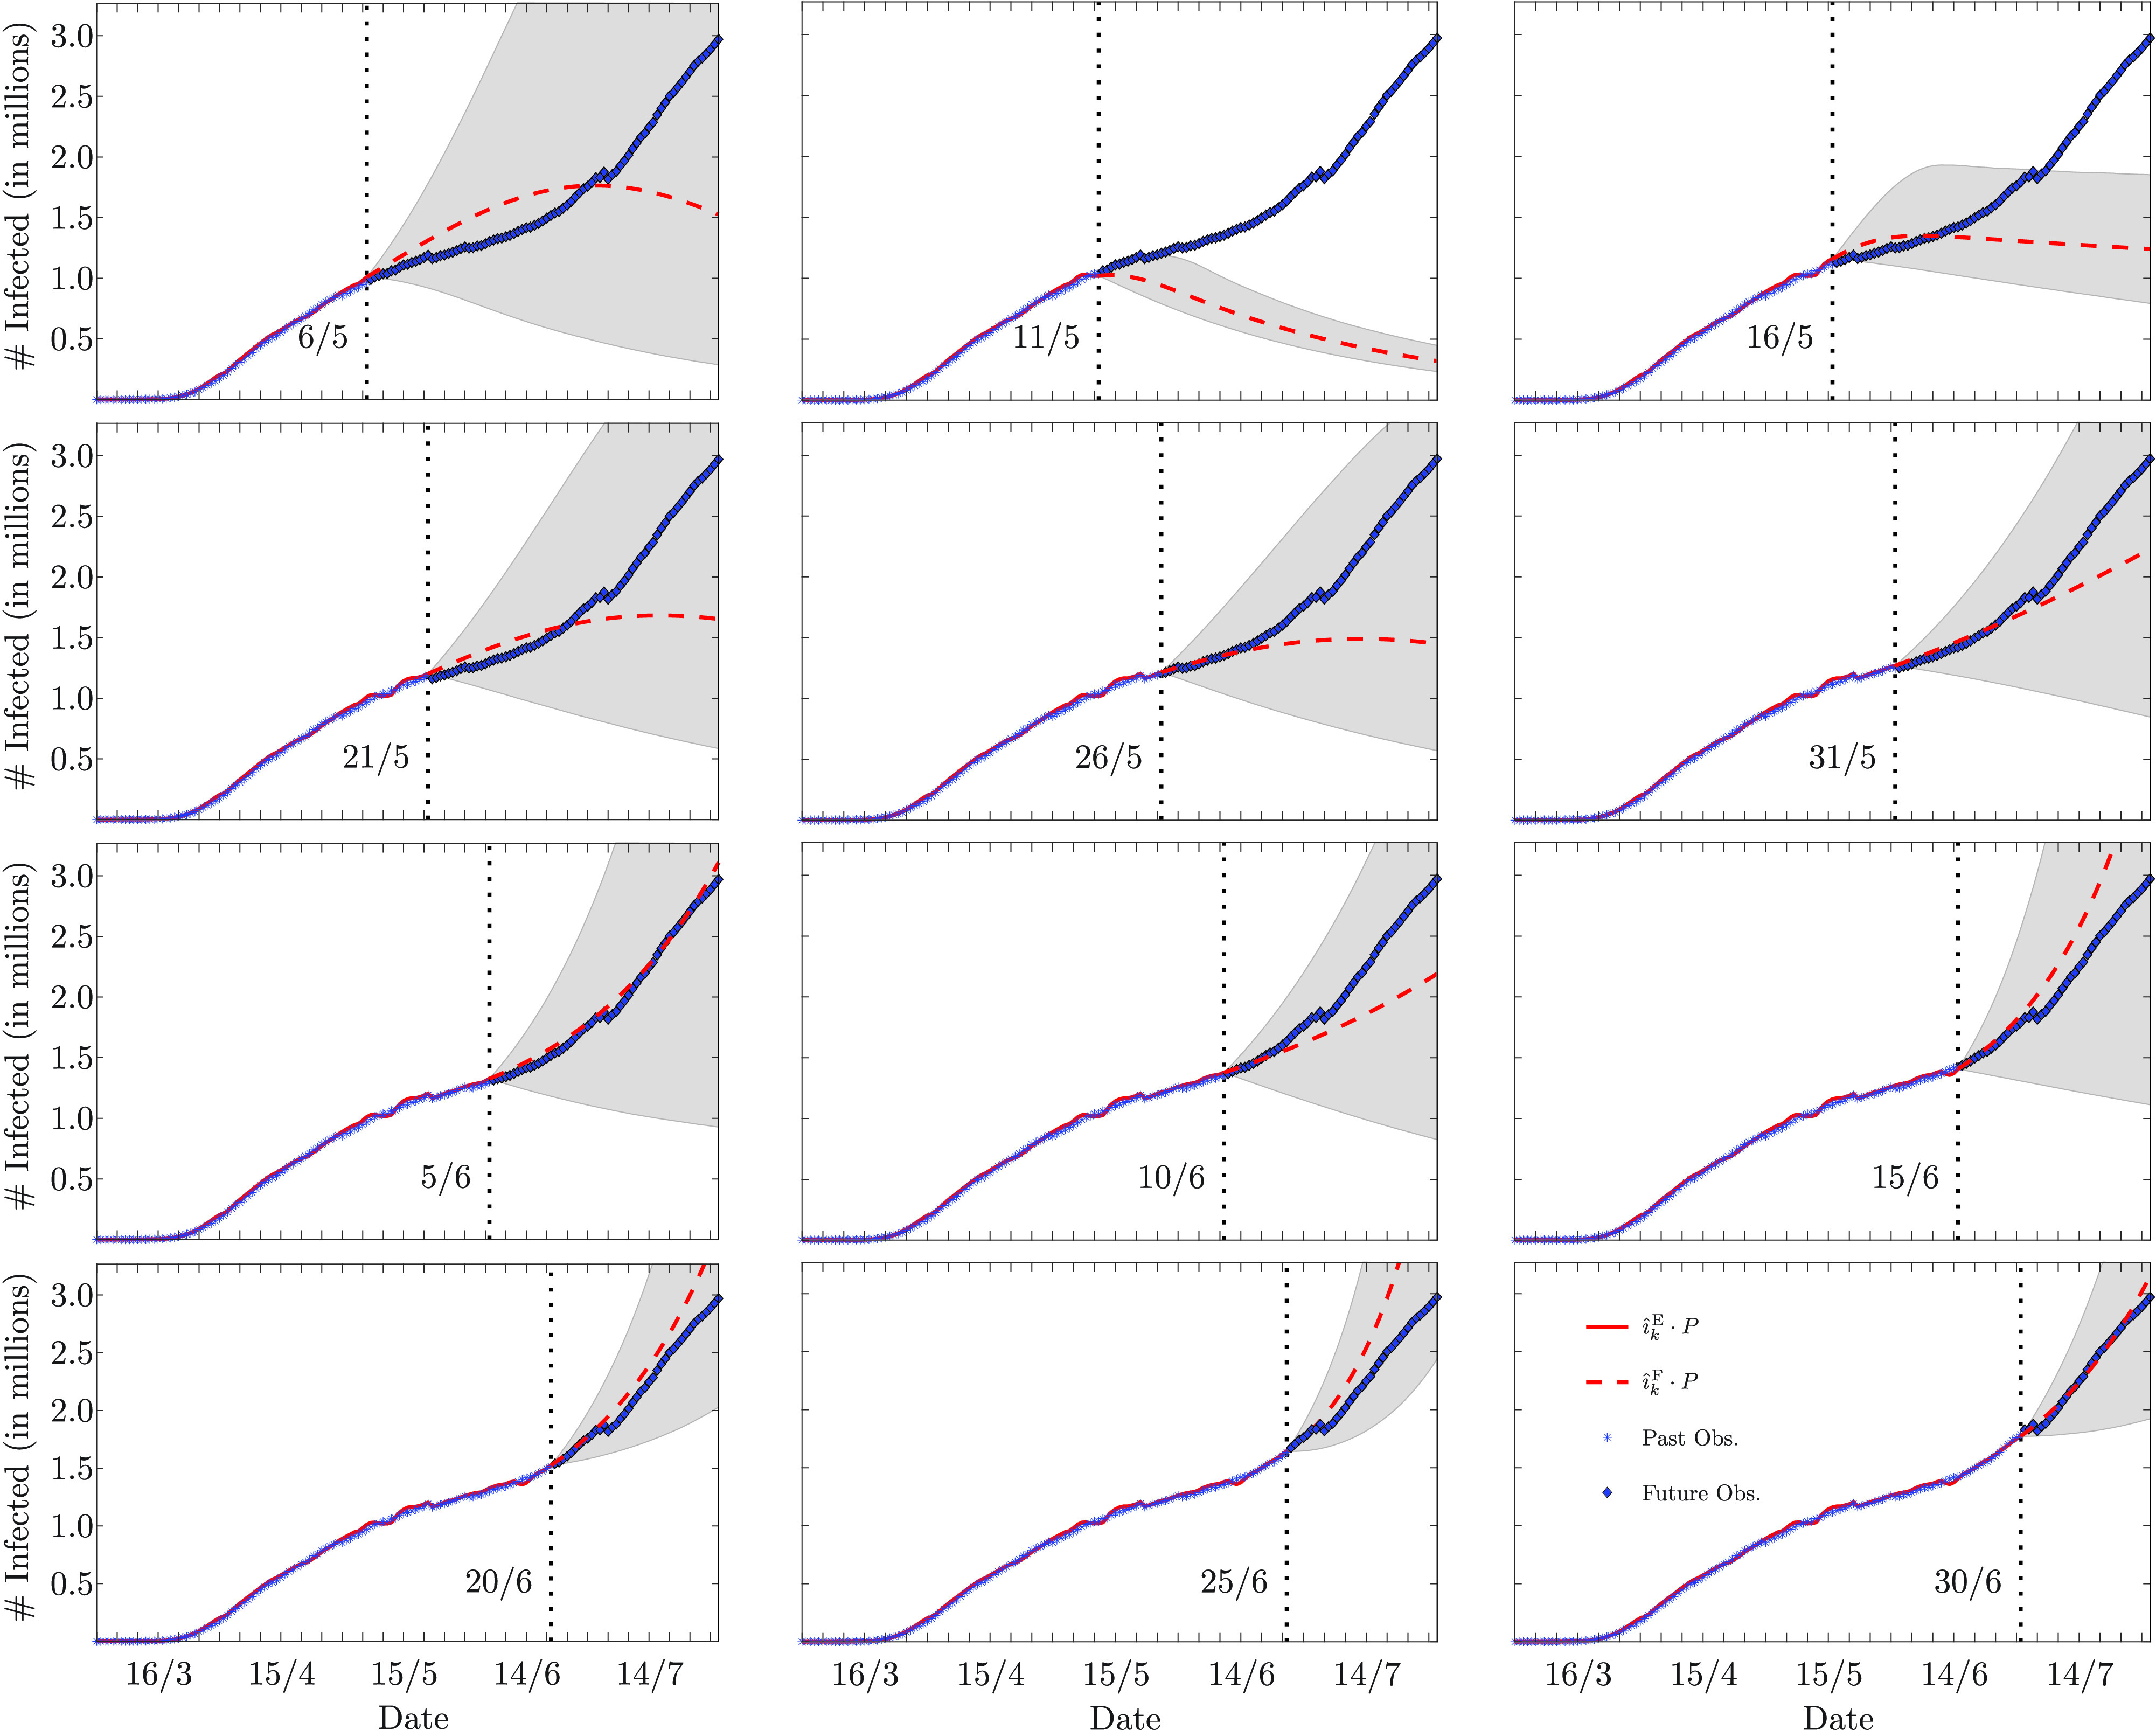
FIGURE 11.

Estimation and forecasting, respectively in solid and dashed lines, of the number of infected individuals in the USA (legend is reported in the bottom-right corner image; the superscript E stands for estimate, and the superscript F stands for forecast). The date corresponding to the end of the estimation and the beginning of the forecast is marked by a vertical dotted line. In all the cases, the forecast horizon is July 31. The shaded area represents the 90% confidence interval. The poor forecasts made on May 11 and 16, relate to the abrupt decrease of the estimated recovery rate that follows April 30 (cf. Fig. 10, bottom image).
