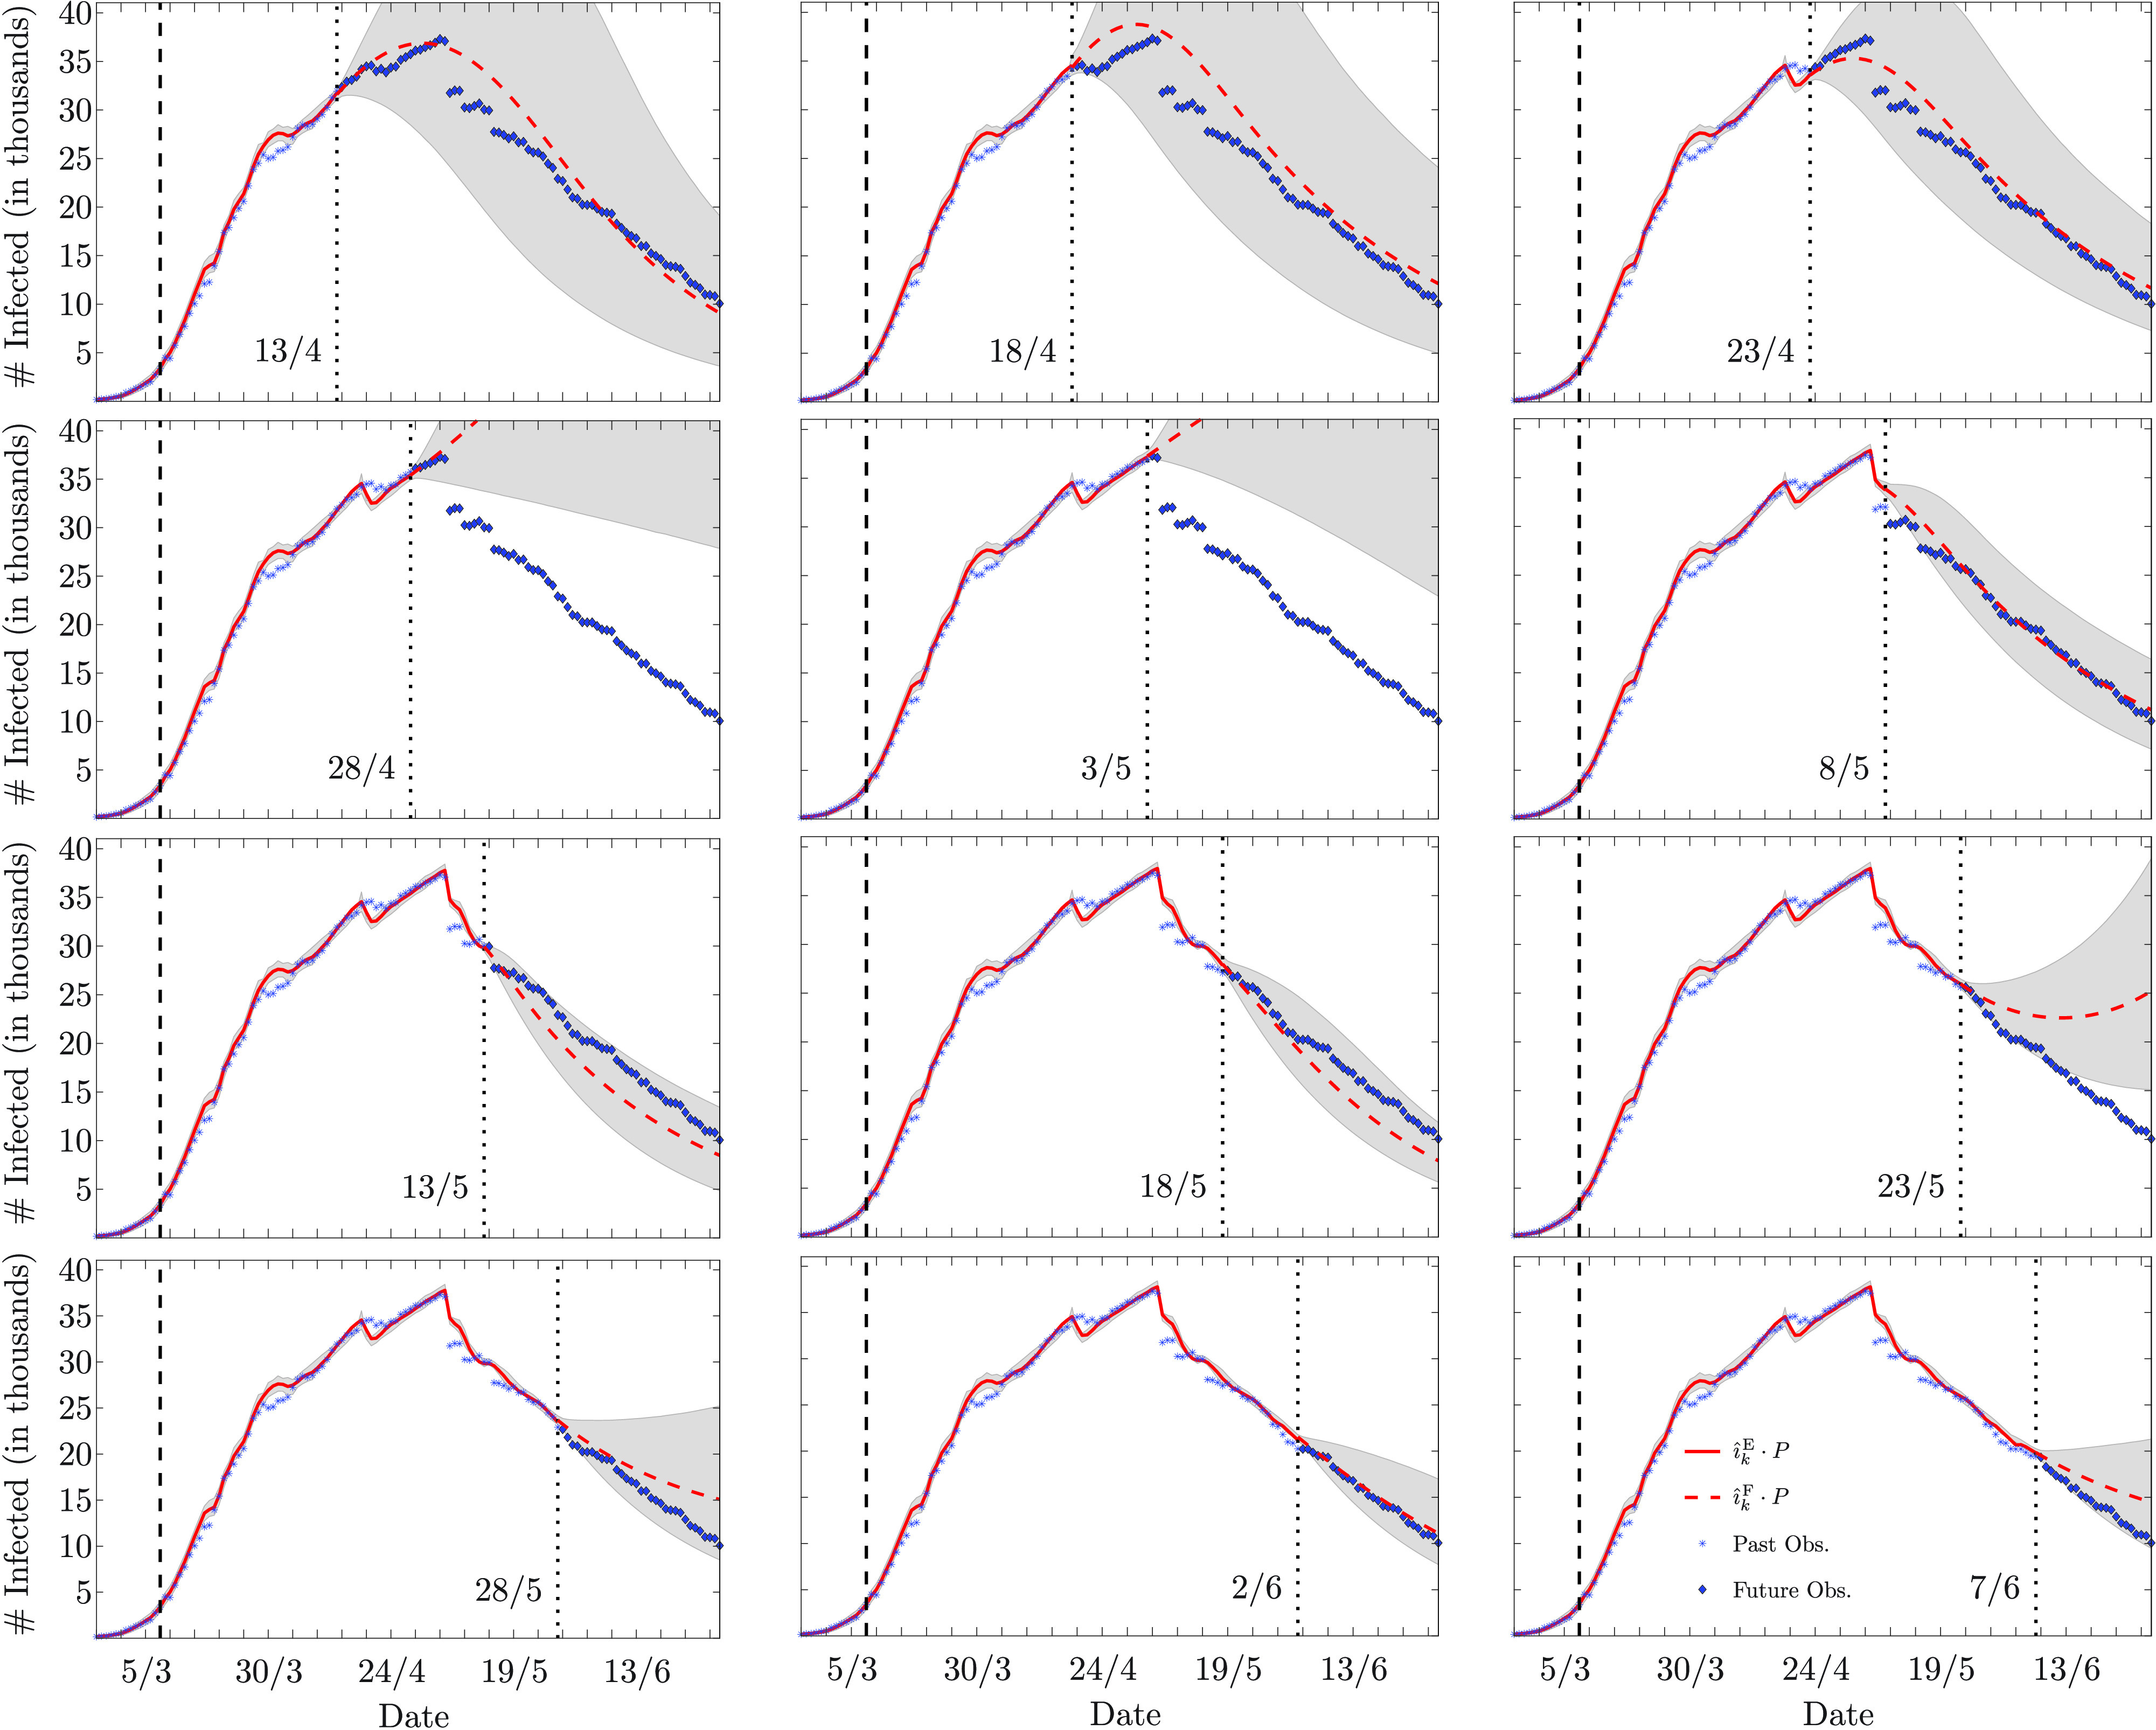
FIGURE 8.

Estimation and forecasting, respectively in solid and dashed lines, of the number of infected individuals in Lombardia, Italy (legend is reported in the bottom-right corner image; the superscript E stands for estimate, and the superscript F stands for forecast). The date corresponding to the end of the estimation and the beginning of the forecast is marked by a vertical dotted line (the leftmost vertical dashed line marks March 8, the beginning of the lockdown). In all the cases, the forecast horizon is June 30. The shaded area represents the 90% confidence interval. The poor forecasts made on April 28, and May 3, relate to the inaccurate data later provided on May 6, as explained in Section V-B1.
