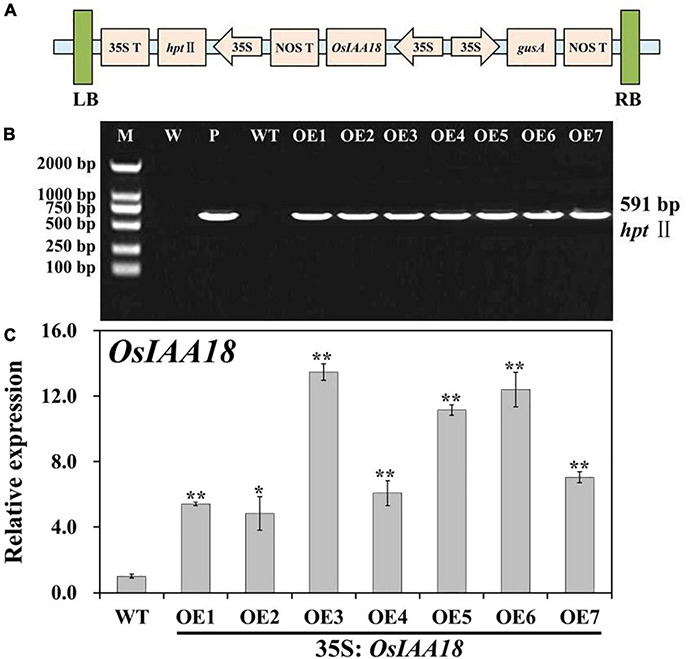
FIGURE 1.

Molecular analyses of the OsIAA18-overexpressing rice plants. (A) Schematic diagram of the T-DNA region of binary plasmid pCAMBIA1301-OsIAA18. LB left border; RB right border; hptII hygromycin phosphotransferase II gene; OsIAA18 rice auxin/indoleacetic acid (Aux/IAA) transcription factor gene; gusA β-glucuronidase gene; 35S cauliflower mosaic virus (CaMV) 35S promoter; 35S T CaMV 35S terminator; NOS T nopaline synthase terminator. (B) PCR analysis of transgenic rice plants. Lane M, DL2000 DNA marker; Lane W, water as negative control; Lane P, plasmid pCAMBIA1301-OsIAA18 as positive control; Lane WT, wild type; Lanes OE1, OE2, OE3, OE4, OE5, OE6, and OE7, overexpressing OsIAA18 rice plants. (C) Expression level of OsIAA18 in the overexpressing OsIAA18 rice plants. The rice OsActin gene was used as an internal control. The results are expressed as relative values based on WT as reference sample set to 1.0. Data are presented as means ± SE (n = 3). The values for * and ** indicate a significant difference from that of WT at P < 0.05 and < 0.01, respectively, by Student’s t-test.
