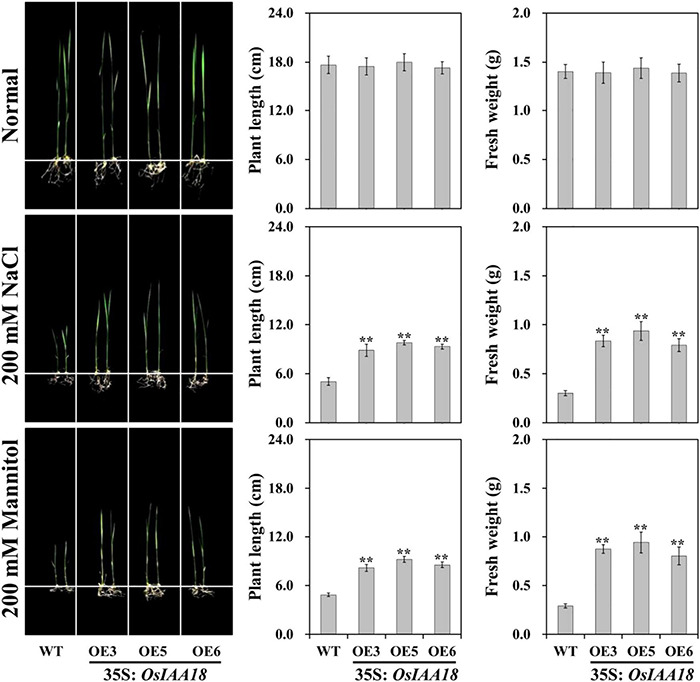
FIGURE 2.

Growth performance of overexpressing OsIAA18 and WT seedlings under 200 mM of NaCl and 200 mM of mannitol, respectively. Plant length and fresh weight of 7th-day old seedlings after transplantation. Data are presented as means ± SE (n = 3). The values of * and ** indicate a significant difference from that of WT at P < 0.05 and < 0.01, respectively, by Student’s t-test.
