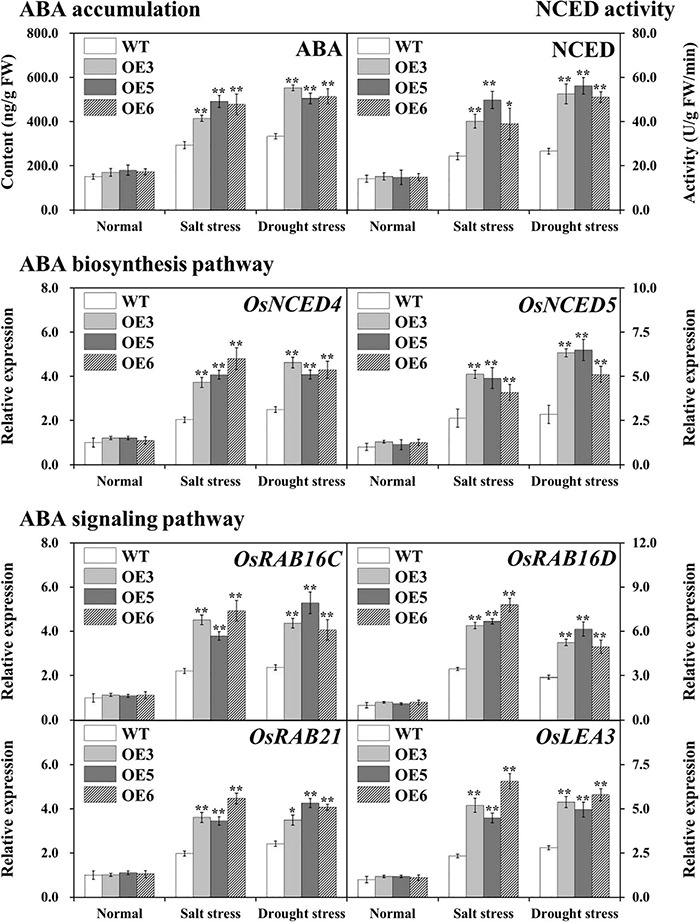
FIGURE 6.

ABA accumulation and the expression of ABA biosynthesis and signaling pathways marker genes in the leaves of overexpressing OsIAA18 and WT plants under salt and drought stresses. Data are presented as means ± SE (n = 3). The values of * and ** indicate a significant difference from that of WT at P < 0.05 and < 0.01, respectively, by Student’s t-test.
