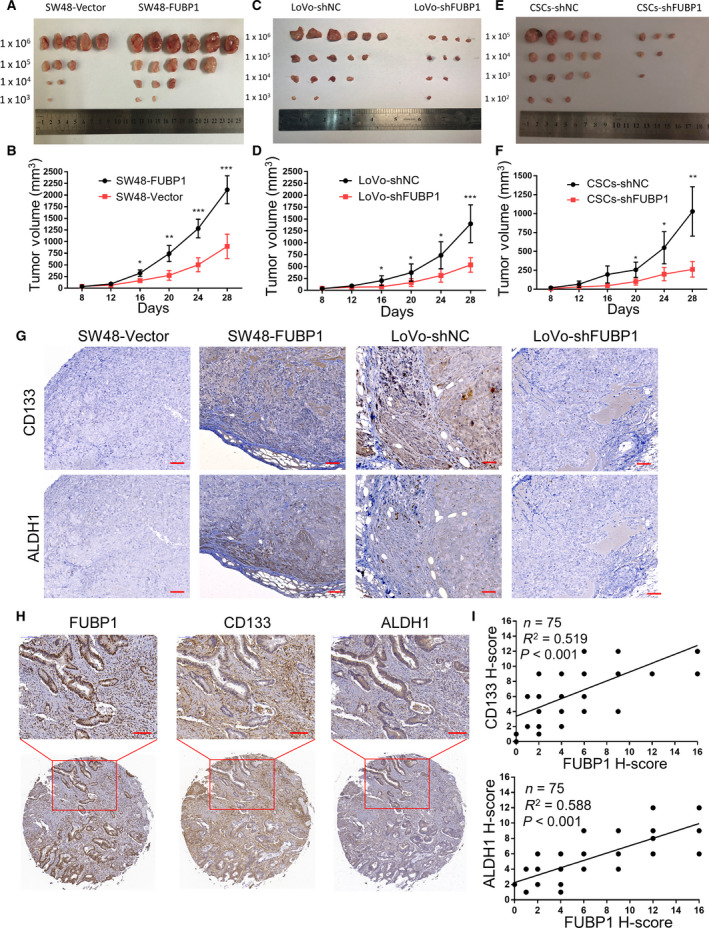
Fig. 4.

Elevated FUBP1 enhances the tumorigenicity of CRC cells in vivo. (A, C, E) Representative images of the tumors were shown. (A) Tumors formed by FUBP1‐transfected SW48 cells and vector control. (C) Tumors formed by FUBP1‐silenced LoVo cells and control LoVo cells. (E) Tumors formed by FUBP1‐silenced cells which were CD133+ALDH1+ cells sorted from LoVo cells and its control cells. Cells (1 × 10⁶, 1 × 10⁵, 1 × 10⁴, 1 × 10³, or 1 × 10²) were implanted into BALB/c nude mice (n = 6, per group). Tumor formation growth curves following implantation of the 1 × 10⁶ (B) (D)or 1 × 10⁵ (F) indicated cells. P values were determined by two‐tailed Student’s t‐test. (G) Representative images of IHC staining of CD133, ALDH1, and FUBP1 in tumor tissues of mice originated from the indicated cells. Scale bar, 50 μm. (H) Representative images of FUBP1, CD133, and ALDH1 IHC staining of CRC Tissue Microarrays (HCol‐A150CS‐02‐M‐013, 75 cases). Scale bar, 100 μm. (I) FUBP1 expression with the expression of CD133 and ALDH1 in 75 CRC patient specimens was determined by Pearson’s correlation analysis. All bars represented the mean ± SD of three independent experiments, and *, **, and *** denotes P < 0.05, P < 0.01, and P < 0.001, respectively.
